

TL;DR
- A checkpointing layer sits under your GPU workload the whole time it runs, not only at the moments it saves state. So before you put one into production you want to know the checkpointing overhead while nothing is going wrong.
- The published figures do not settle it on their own. Each one was measured on one machine with one workload. Two of the four are microbenchmarks that issue driver calls as fast as the GPU can take them, which is the condition that makes the cost show in full.
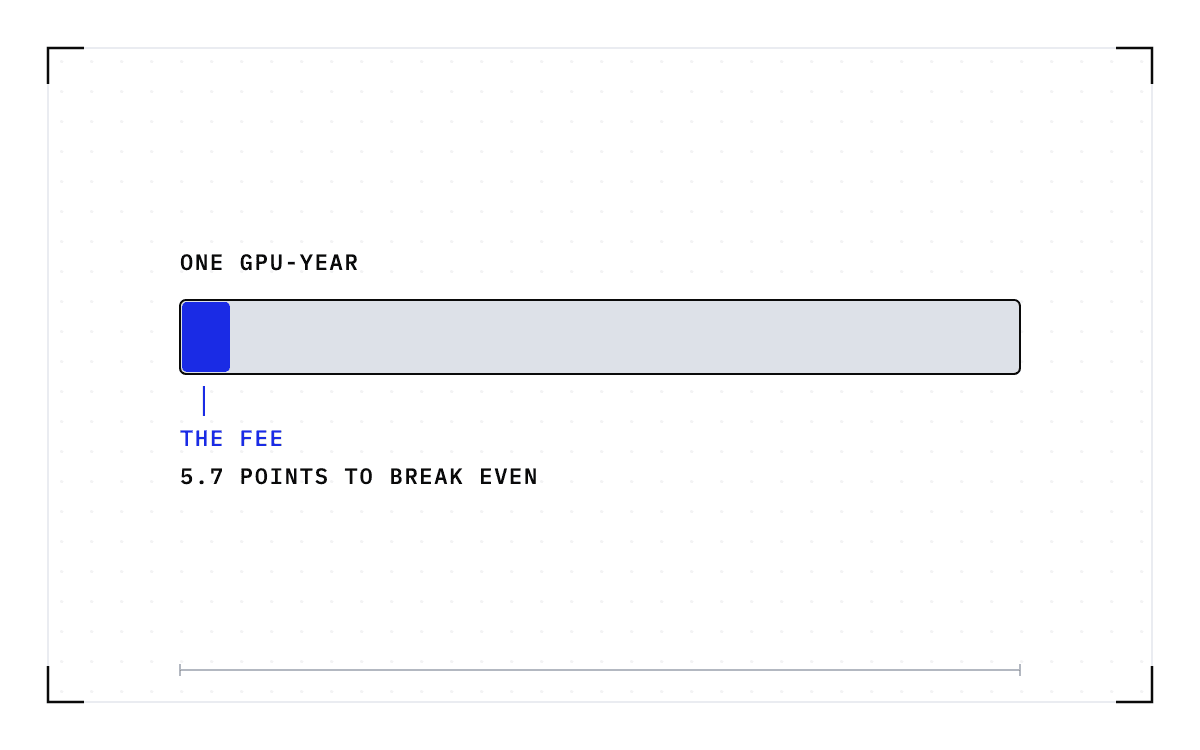
- The cost is CPU work, paid once for every CUDA driver call your job makes. Most GPU jobs leave the CPU idle waiting on the GPU, so on many of them it hides. Cedana is automated GPU checkpointing and migration infrastructure that increases the useful work your GPUs deliver. Cedana's steady-state overhead is under 2%, often closer to zero. Where your own job sits in that range depends on how many driver calls it issues for each unit of GPU time.
- In this piece we walk through where the cost comes from, and what each published benchmark measured and on what machine. Then we cover why one inference benchmark came out faster than native, and the four things the published set does not answer.
The cost is CPU work, and most GPU jobs leave the CPU waiting
Checkpointing a job means saving its full running state so the job can be brought back later, on the same machine or on a different one. Doing that for a process that uses an NVIDIA GPU needs low-level access to the driver, and NVIDIA's drivers are proprietary.
So we intercept the CUDA driver API while the process runs, which means every driver call the application makes passes through our layer on its way to the GPU. The layer sits below the CUDA runtime and well below the application. From there it can see what the workload is doing on the GPU without the application having been written to cooperate, it can capture and restore GPU state reliably for workloads that use several GPUs, and it makes live migration possible, meaning a running workload can be moved onto another machine.
Sitting there costs CPU time. One more layer runs on the host CPU for every driver call, so the cost is paid per call and it does not go away as the job runs. How much of it you see depends on the ratio of driver calls to GPU time.
Most GPU workloads leave the CPU idle while it waits for the GPU to finish. So on a job that issues few calls per unit of GPU time, the added CPU time fits inside that idle time and the throughput does not move. A microbenchmark that issues calls as fast as the GPU can take them leaves no idle time for the cost to hide in, so it shows the cost in full.
Every published figure names its own machine
Our public documentation carries four benchmarks of the checkpointing overhead, and they ran on three machines, every one of them a single-GPU box.
| What was measured | The workload | CPU and GPU |
|---|---|---|
| Raw GPU performance | In-device memory bandwidth and compute throughput | AMD EPYC 7R13, NVIDIA L4 |
| Concurrent kernel launch | Time taken to launch multiple kernels concurrently | Intel Xeon Platinum 8480+, NVIDIA H100 PCIe |
| Memory transfers | Throughput from GPU to host and host to GPU | Intel Xeon Platinum 8480+, NVIDIA H100 PCIe |
| Training over time | A 120-million-parameter model, training continued | AMD EPYC 7R13, NVIDIA L4 |
The first two rows are microbenchmarks rather than production workloads, so they are the case with no application work between calls and no idle time for the cost to hide in.
The more driver calls per unit of GPU time, the more the layer costs
Across all four benchmarks the number tracks one ratio: how much interception work runs on the CPU for each unit of work on the GPU. Launching many kernels at once, or moving many small buffers, means many driver calls for a small amount of GPU time, so the cost of the layer is visible. A long training run means a large amount of GPU time for each driver call, so the cost mostly disappears into time the CPU was going to spend waiting anyway.
Memory transfers move with that same ratio, and they are the one benchmark we publish no figure for. We report minimal degradation on small transfers instead. A small transfer is where interception does the most work per byte, because moving the same quantity of data in smaller pieces takes more CUDA calls.
We measured the training case twice, once against model size and once over time. As the model got bigger, the overhead of each training iteration grew with it. On a 120-million-parameter model measured over time, the overhead came down as training continued. We think the run settled into long GPU kernels with fewer driver calls per unit of GPU time, which is a hypothesis about the cause rather than something we measured.
So a serving worker that spends its time inside long kernels pays the least, and a job that keeps the CPU busy issuing driver calls pays the most. The figure you should expect depends on which of those your own work resembles.
One inference benchmark came out faster than native
On a vLLM throughput benchmark of Llama 3.1 8B, throughput was higher with our layer in place than without it.
| Throughput | Native | Cedana |
|---|---|---|
| Requests per second | 11.69 | 13.85 |
| Total tokens per second | 4833.43 | 5725.69 |
| Output tokens per second | 2318.23 | 2746.18 |
We put that down to where the layer sits. It sees driver API calls before they execute, so it can combine them or cancel redundant ones. The result surprised us, because interception usually costs runtime performance.
The scope is one benchmark, one model, one GPU. The run used an AMD EPYC 7J13 CPU with an NVIDIA A100 SXM4 40GB GPU, on GPU driver 570.124.04, with Cedana pinned at version v0.9.240-35-g9bd7886e. It is the best case in the published set, and nothing in that set supports a general claim that running under Cedana is faster than running native.
The published set leaves four things unanswered
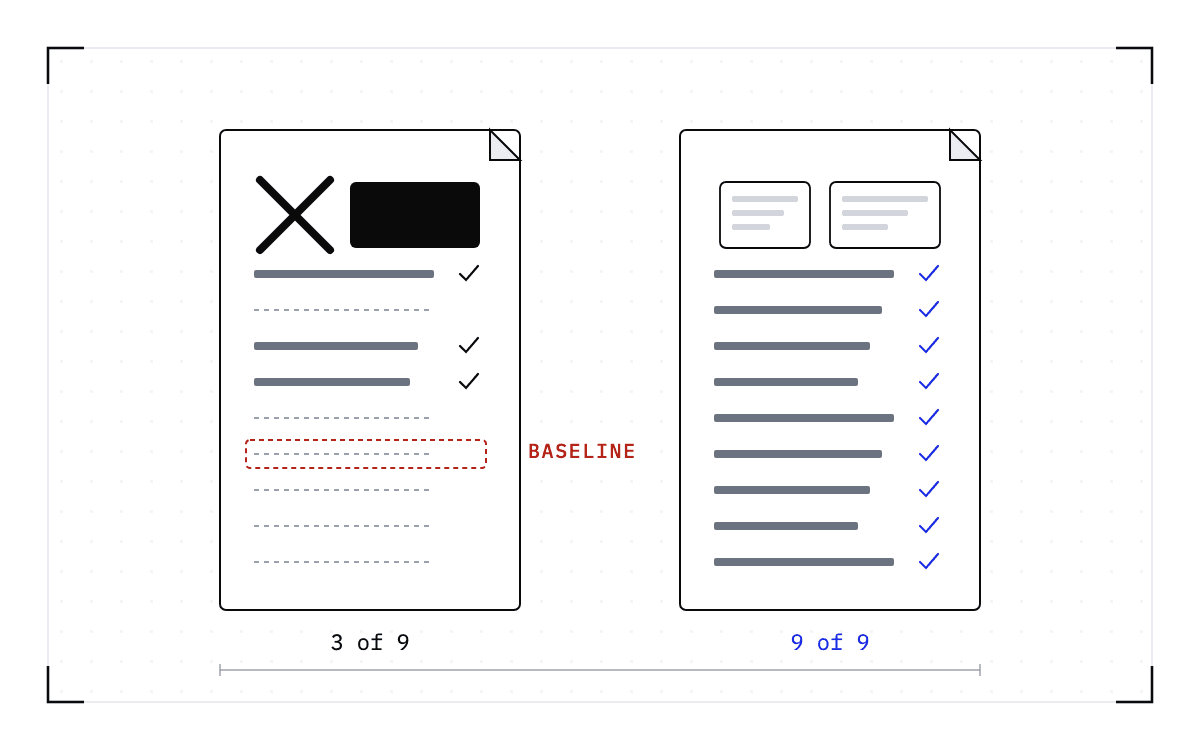
Every published rig is a single-GPU machine, so the set carries no multi-GPU steady-state figure at all. What the layer costs on a job that spans several GPUs is a question these benchmarks do not answer.
Those rigs and that page are also getting old. The GPUs in the published set are an NVIDIA L4, an A100 SXM4 40GB, and an H100 PCIe, and the page carrying the results is about a year old as of September 2026. Performance is a moving target, and the page says so.
Everything here measures the cost of running under interception, which is a different measurement from the cost of taking a checkpoint. Checkpoint time, restore time, and the throughput of writing a checkpoint out to storage each have their own conditions, and the steady-state figure describes none of them.
The comparison you probably came for is not published either. No published measurement compares the overhead of checkpointing inside the application against checkpointing below it, so there is no ratio to give.
In our experience, the application-level version is the more expensive of the two in practice. It holds the workload frozen for longer, and what it writes is slower to move and to resume from, so it consumes more of the run and more network time per checkpoint.
A system-level checkpoint holds more bytes, but the cost we see is in the time the workload is frozen and the time to bring it back, not in the byte count, and that is our observation across deployments rather than a published measurement. Because each application checkpoint costs more of the run, teams take fewer of them, so a failure loses more work.
Interception is the price of keeping the work when the hardware stops
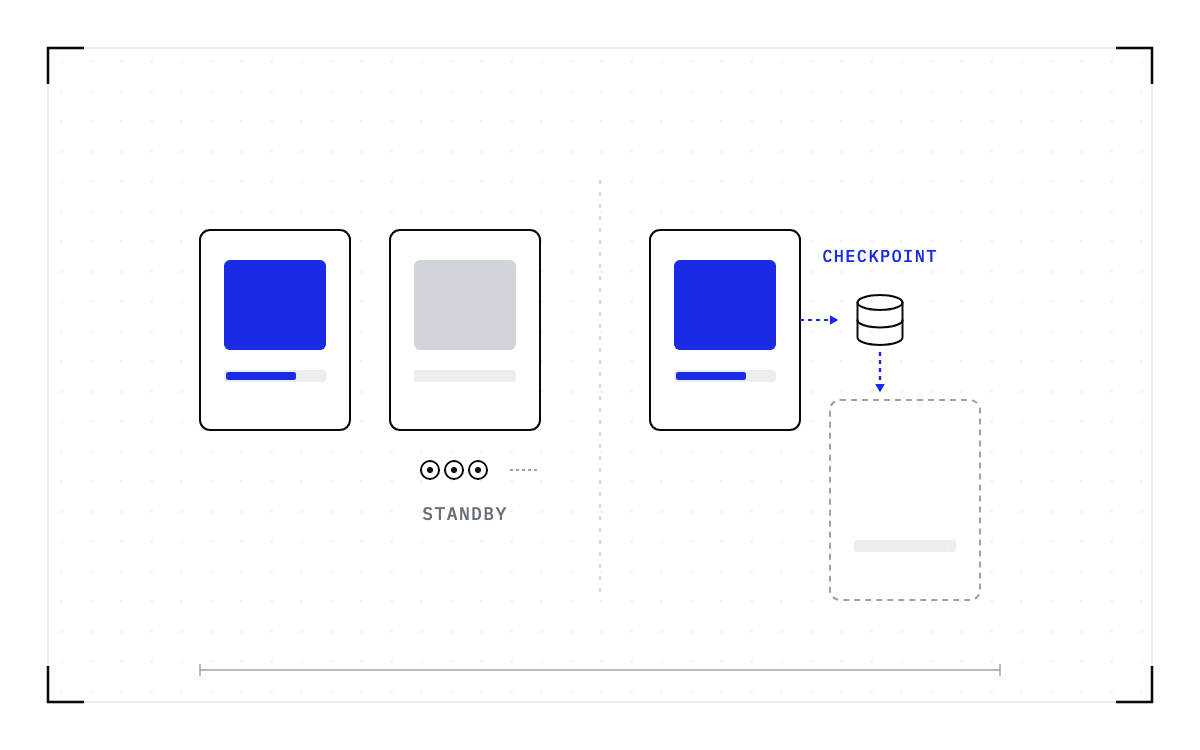
So the layer costs you CPU time on every driver call, for as long as the job runs, whether or not anything ever goes wrong. That is the trade. You pay it so that when the hardware does stop, the job is saved and brought back on healthy hardware instead of started again from nothing.
Whether the trade is worth making on your own cluster comes down to two things you can measure without us: how many driver calls your workloads issue for each unit of GPU time, and how much work one interruption costs you today.
Related:
- Which checkpointing approach brings back the state your job is holding?
- System-level vs application-level GPU checkpointing: the category and the bar
- How to read a checkpoint benchmark
- Hot standby versus checkpoint recovery on the same hardware
Common questions
What does a GPU checkpointing layer cost while the workload runs?
The cost is CPU work rather than GPU work, because one more layer runs on the host for every CUDA driver call the job makes. Cedana's steady-state overhead is under 2%, often closer to zero. Where it shows up depends on the workload: a serving worker that spends its time inside long kernels pays the least, and a job that keeps the CPU busy issuing driver calls pays the most.
Is application-level checkpointing cheaper than a system-level layer like Cedana's?
No published measurement compares the overhead of checkpointing inside the application against checkpointing below it, so there is no ratio to give. In our experience the application-level version is the more expensive of the two in practice. It holds the workload frozen for longer, and what it writes is slower to move and resume from, so teams take fewer of them and a failure loses more work. A system-level checkpoint holds more bytes, but the cost we see is in the frozen time and the time to come back, not the byte count.