


Cedana Editorial

Engineering notes and field reports from the Cedana team.
Posts · 95
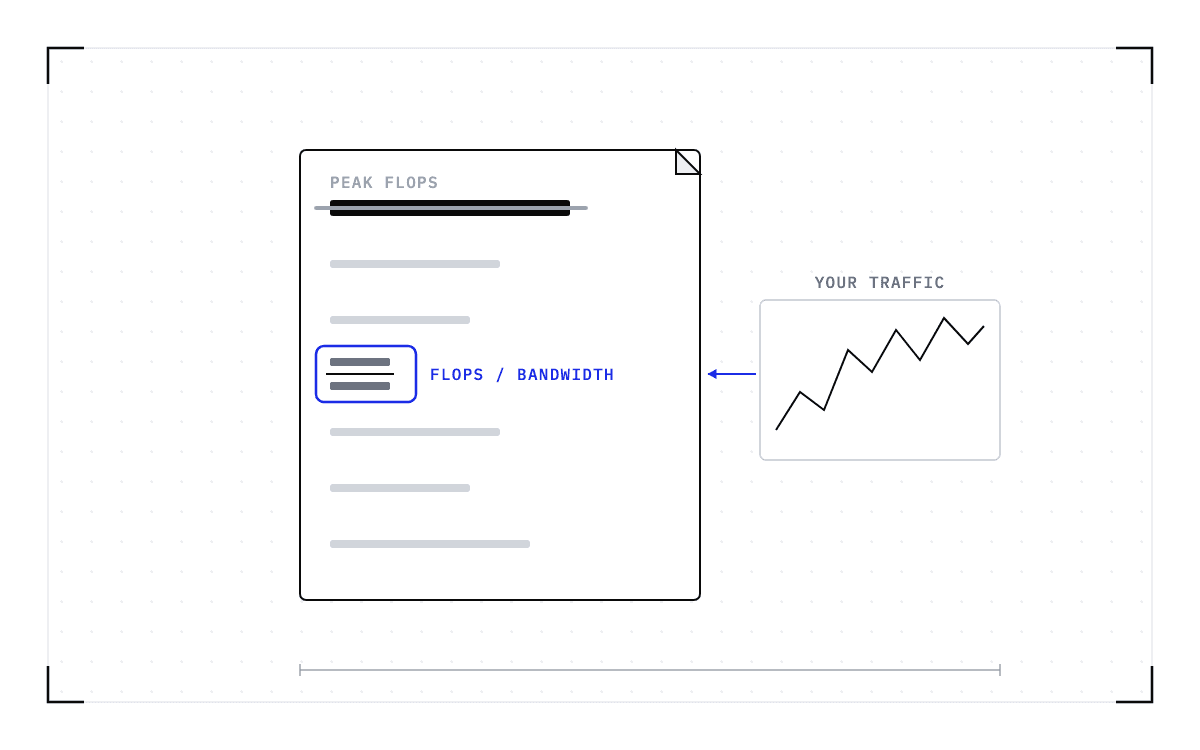
Cedana. Blueprint of a document with a folded corner and seven rows. The top row is a heavy black bar struck through by a grey line. The fourth row is a small fraction, two short bars with a line between them, ringed in blue. To the right a small framed chart with a jagged rising line sends a blue arrow toward the ringed row.How to choose a GPU for LLM inference

How to choose a GPU for LLM inference

Build an inference GPU shortlist using your traffic, memory needs, precision, latency, interconnect and rack cost, then measure startup and recovery on your path.

read →
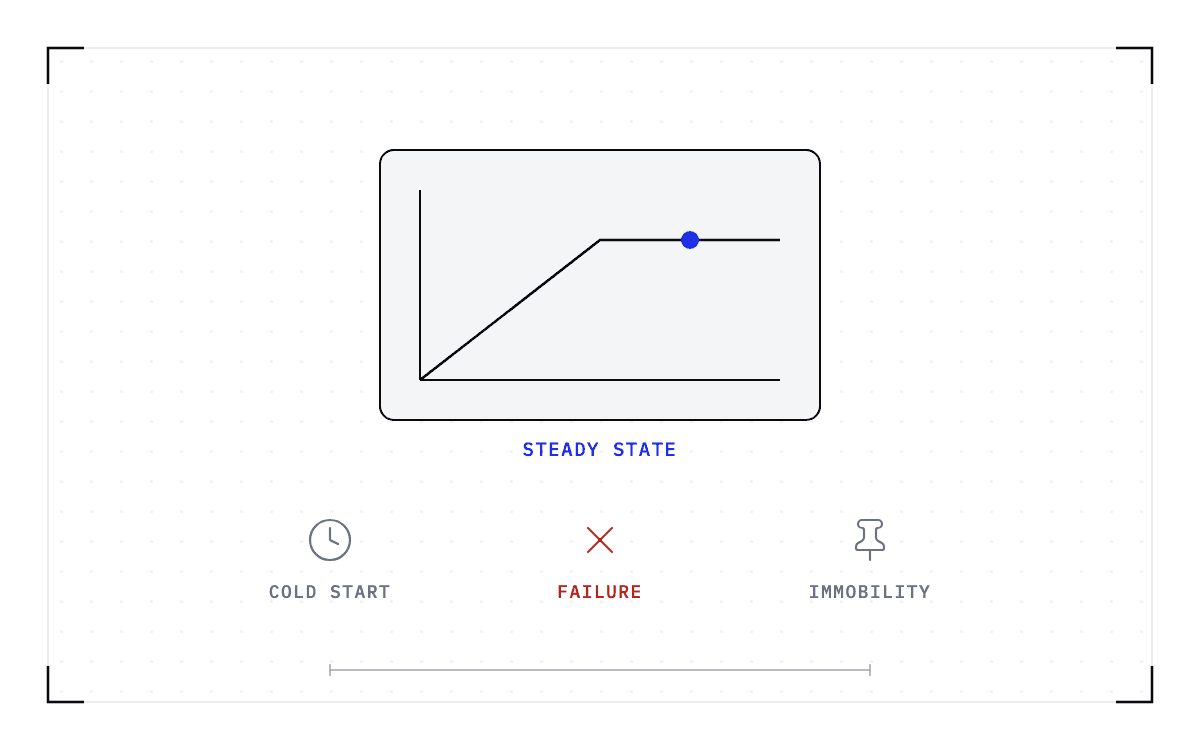
Cedana. Blueprint of a rounded panel holding a small chart, a line that rises and then runs flat with one blue dot on the flat part, marked steady state. In a row beneath the panel, three icons with their names: a grey clock marked cold start, a red cross marked failure, and a grey pin marked immobility.What roofline analysis cannot see: the costs outside the steady state

What roofline analysis cannot see: the costs outside the steady state

Add startup, recovery and movement time to your inference measurements. Understand what steady-state roofline analysis explains and which fleet costs sit outside it.

read →
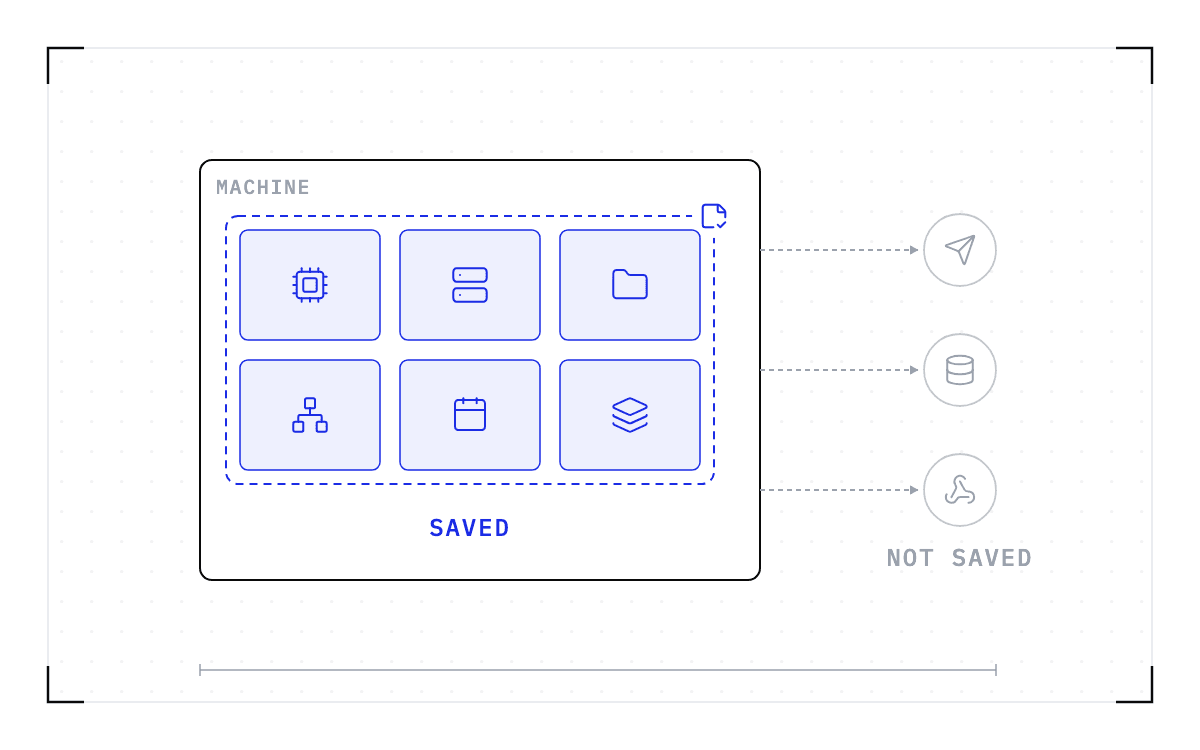
Cedana. Blueprint of one machine drawn as a large outlined box holding six pale-blue tiles with line glyphs: a chip, a server, a folder, a network, a calendar, and stacked layers. A blue dashed outline with a checkpoint mark at its corner encloses all six. Three grey dashed arrows leave the machine's right edge to three grey circles outside it holding a paper plane, a database, and a webhook glyph.What Cedana saves, and what it does not

What Cedana saves, and what it does not

See which GPU, process, file, network and scheduler state Cedana saves, what remains outside the checkpoint, and what a compatible restore requires.

read →
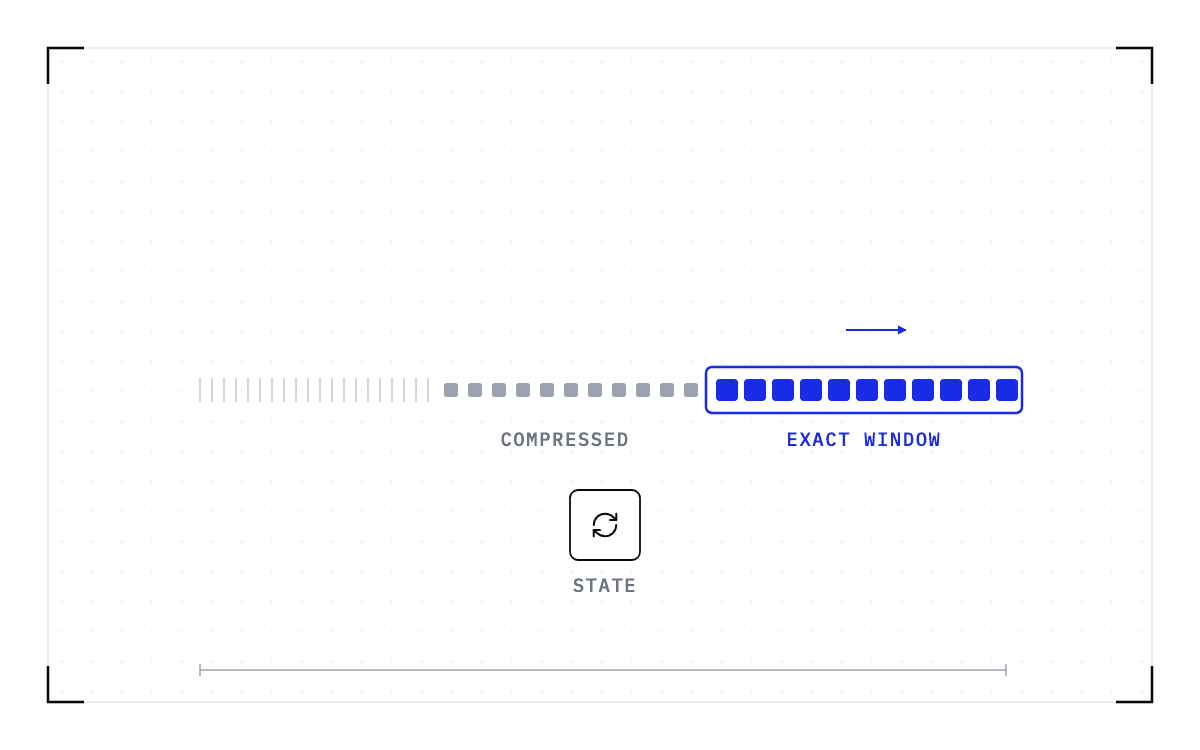
Cedana. Blueprint of one long row. On the left are faint grey ticks, in the middle small pale-grey squares, and on the right larger solid blue squares enclosed in a blue rounded frame with a small blue arrow above it pointing right. Below the frame sits a small outlined box containing a circular arrow.Sliding windows, state space, and the cost of remembering

Sliding windows, state space, and the cost of remembering

Examine how attention layouts bound session memory, distinguish windowing from cache compression, and identify what one published configuration can establish.

read →
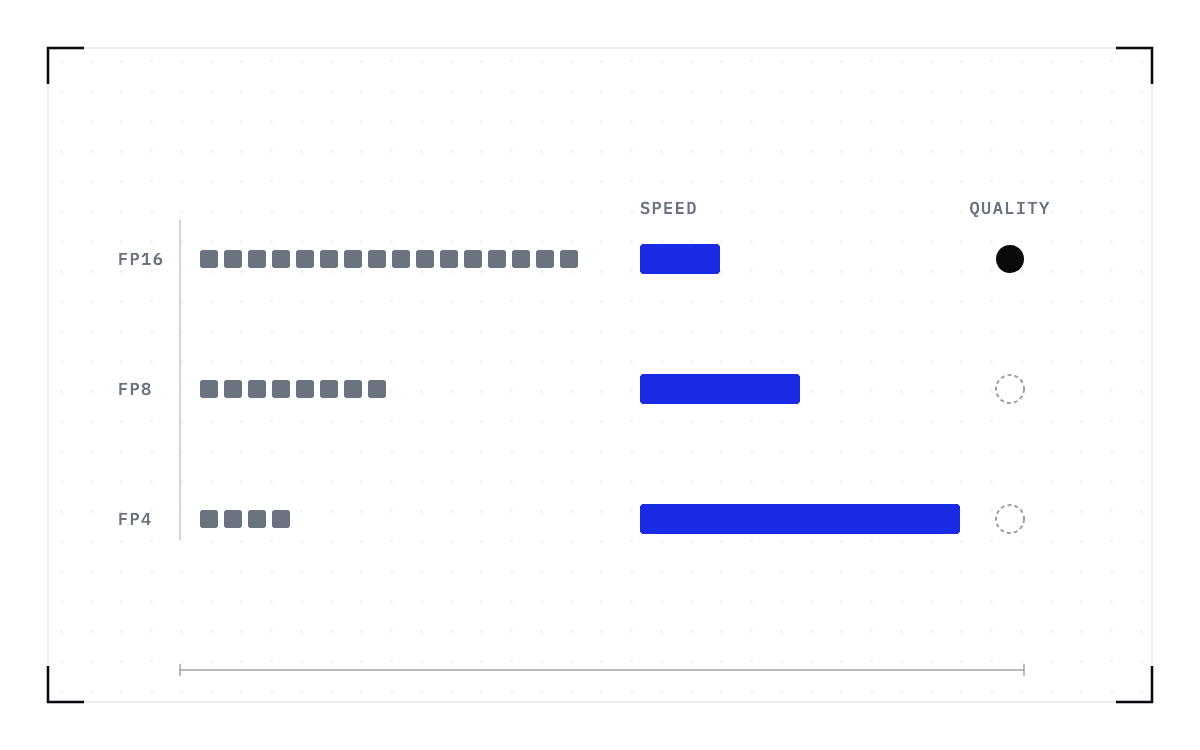
Cedana. Blueprint of three rows. The left of each row holds a run of small grey squares: sixteen, then eight, then four. Beside each run a blue bar that doubles in length row by row. At the right end of each row a circle: solid black on the first row, dashed grey outlines on the second and third.The accuracy budget is part of the performance budget

The accuracy budget is part of the performance budget

Evaluate weight, KV-cache and expert-math precision changes against task quality, latency, throughput and memory on the same workload before changing production.

read →
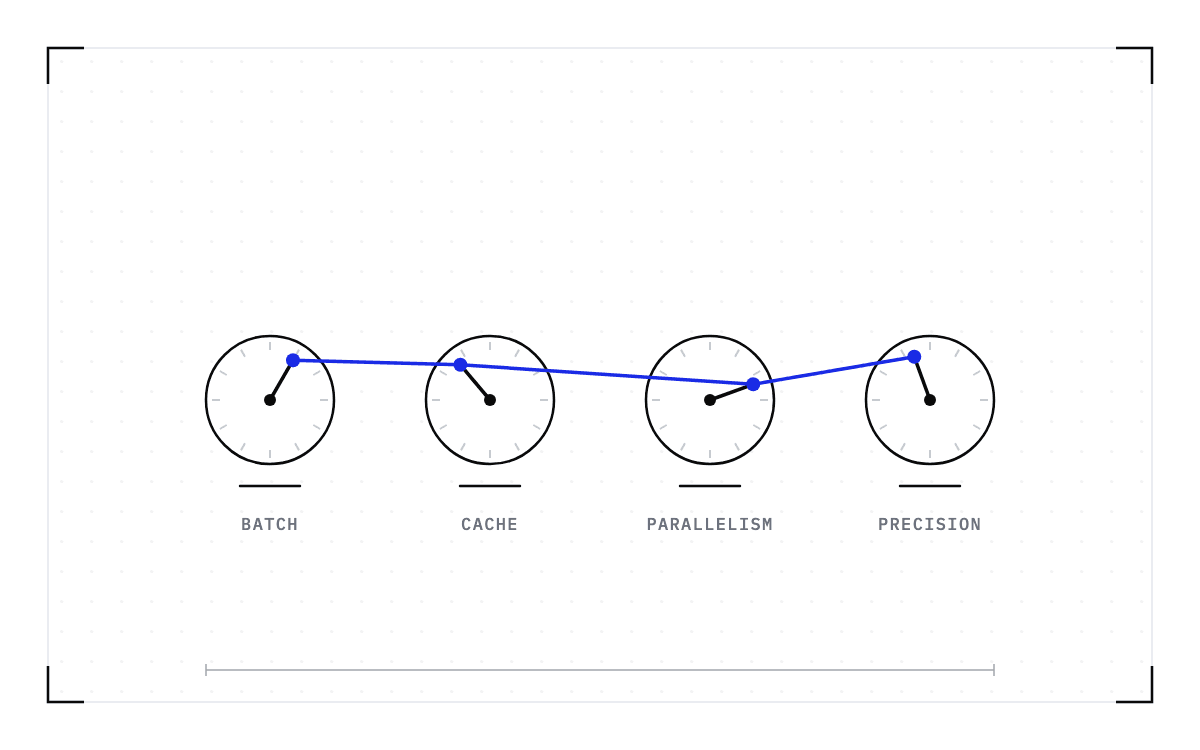
Cedana. Blueprint of four round dials in a row, each with tick marks, a centre pin and a pointer at a different angle, and a short base line beneath. One blue rod runs through the tips of all four pointers, with a blue dot at each tip, so the pointers are linked.What an SGLang serve command commits your deployment to

What an SGLang serve command commits your deployment to

Read SGLang presets as coupled choices about latency, throughput, memory and parallelism. Understand the tradeoffs and keep example values tied to their version.

read →
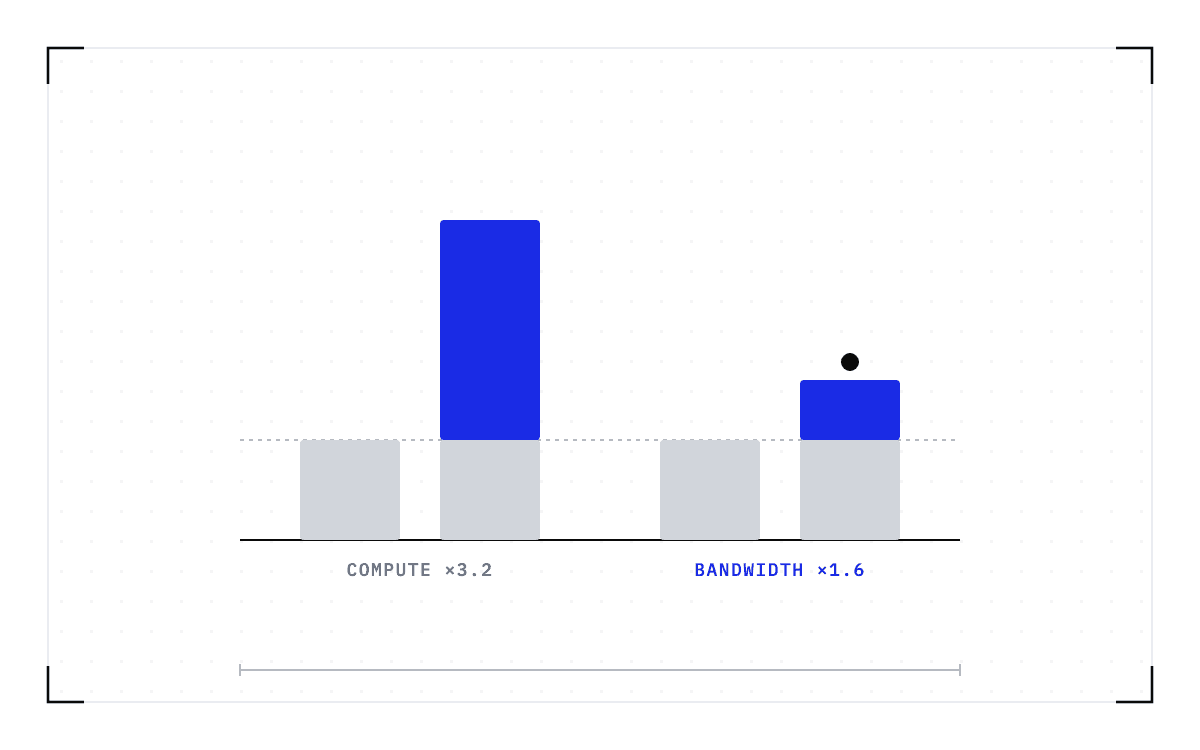
Cedana. Blueprint of two pairs of columns on a baseline with a dashed line at the height of the shorter columns. In each pair the left column is short and grey; the right column has the same grey base with a blue extension on top. The left pair's extension is tall, more than twice the base; the right pair's is small. A black dot rests above the right pair's top.Why more GPU is not a performance plan

Why more GPU is not a performance plan

Use compute, memory bandwidth, capacity and interconnect readings to diagnose inference limits before buying more GPUs. Separate busy hardware from useful output.

read →
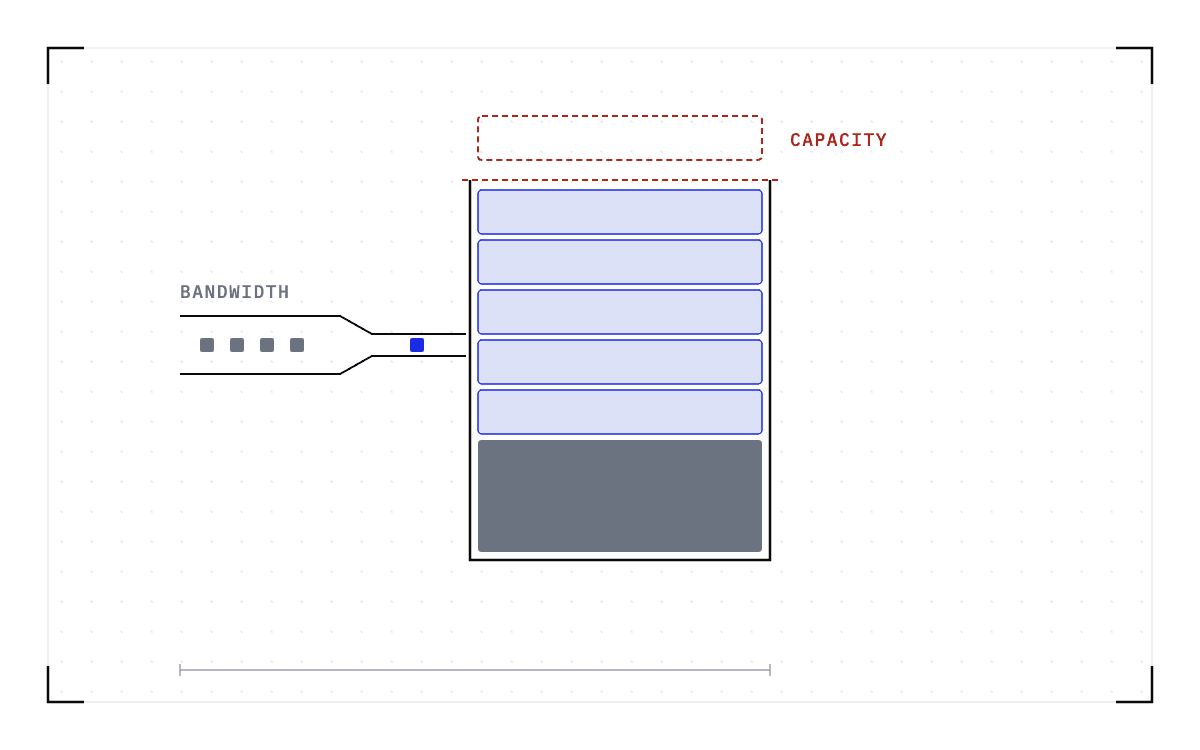
Cedana. Blueprint of a tall open-topped vessel. A dark block fills its bottom and five pale-blue slabs are stacked on it up to the brim, which is marked by a red dashed line; a sixth slab in red dashed outline floats above the opening. From the left a pipe narrows to a thin neck before it meets the vessel, with four grey squares queued in its wide part and one blue square in the neck.Out of bandwidth or out of capacity: memory pressure and the quantization levers

Out of bandwidth or out of capacity: memory pressure and the quantization levers

Distinguish slow token generation from a KV cache that cannot admit more work. Match weight or cache quantization to the limit and test the resulting quality.

read →
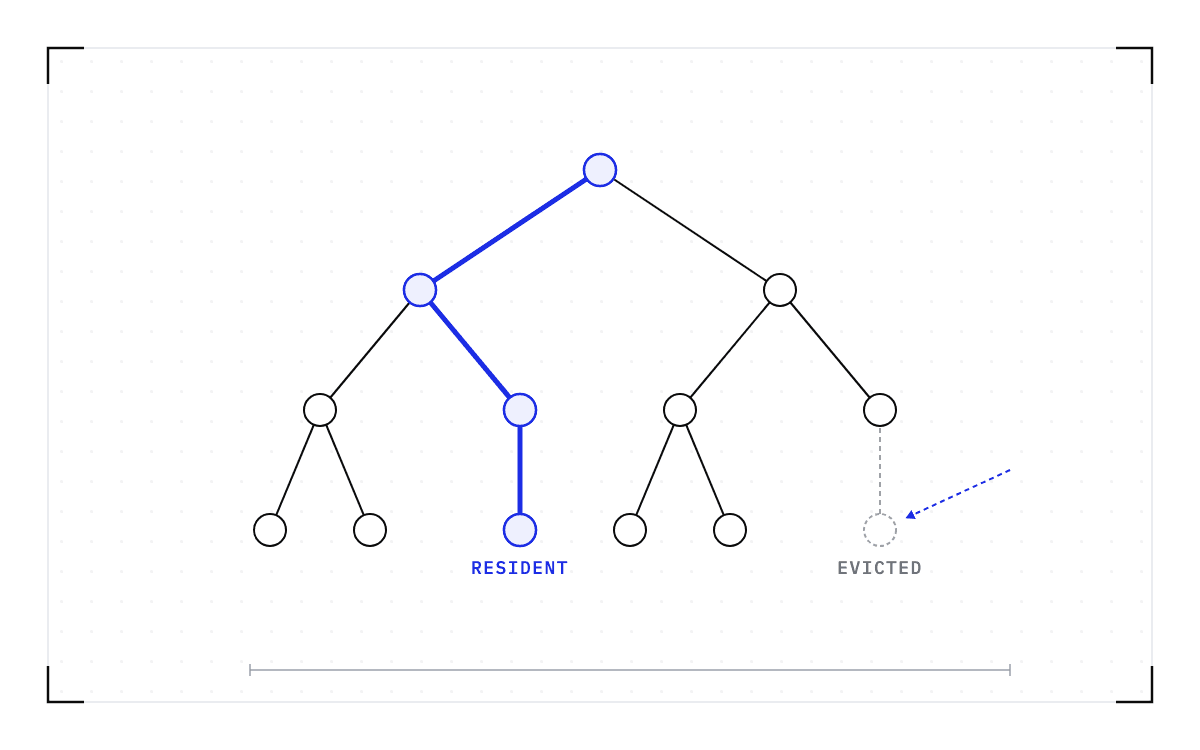
Cedana. Blueprint of a tree of small circles branching downward from one root to six leaves. One path from the root to a leaf is drawn in thick blue with blue-tinted circles. On the far right one leaf and the line to it are dashed grey, and a blue dashed arrow from outside points at that missing leaf.Long context changes the economics of a fast first token

Long context changes the economics of a fast first token

Size long-context serving around first-token latency, cache residency and concurrency. Track prefix misses and tail latency instead of relying on a median alone.

read →
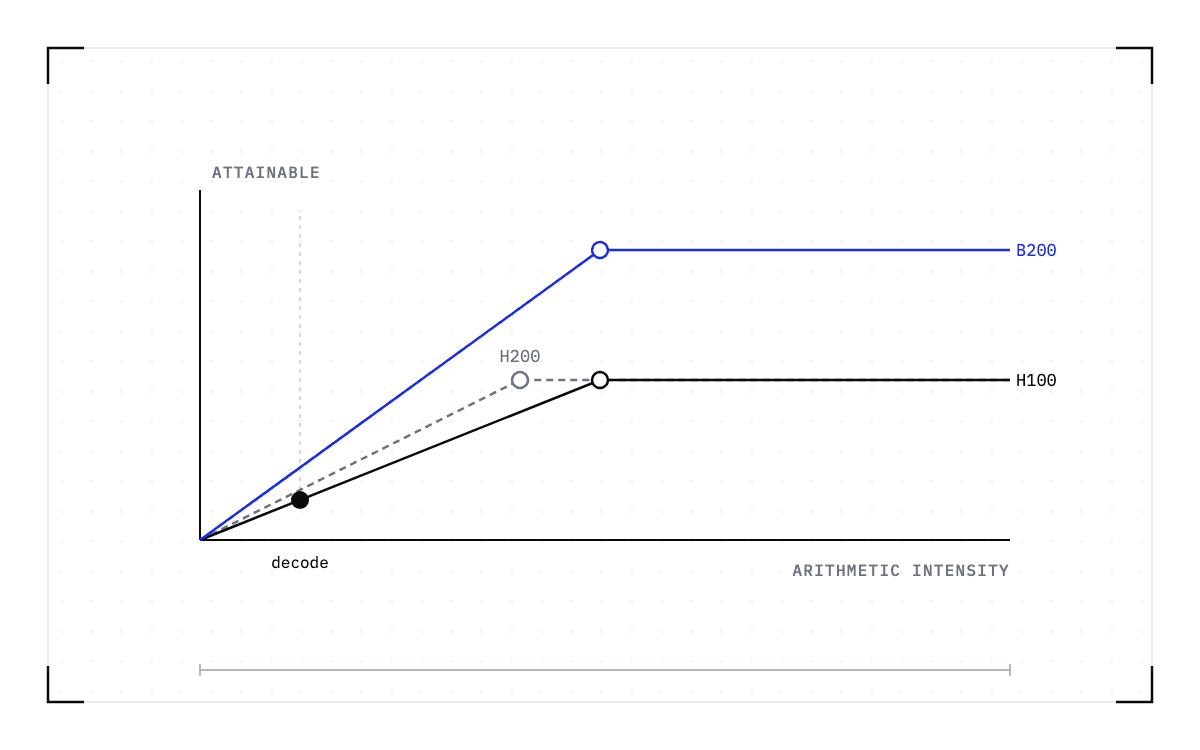
Cedana. Blueprint of a chart with two axes. Three rooflines rise from the origin and flatten: an ink one, a grey dashed one whose knee is further left at the same height, and a blue one whose knee is higher. Each knee is ringed. Far to the left, on a dashed vertical guide, a single black dot sits low on the slope.The two ceilings: why the ridge point is the GPU number that matters

The two ceilings: why the ridge point is the GPU number that matters

Calculate a GPU's ridge point from dense compute and memory bandwidth. Compare H100, H200 and B200 on a consistent basis before diagnosing your workload.

read →
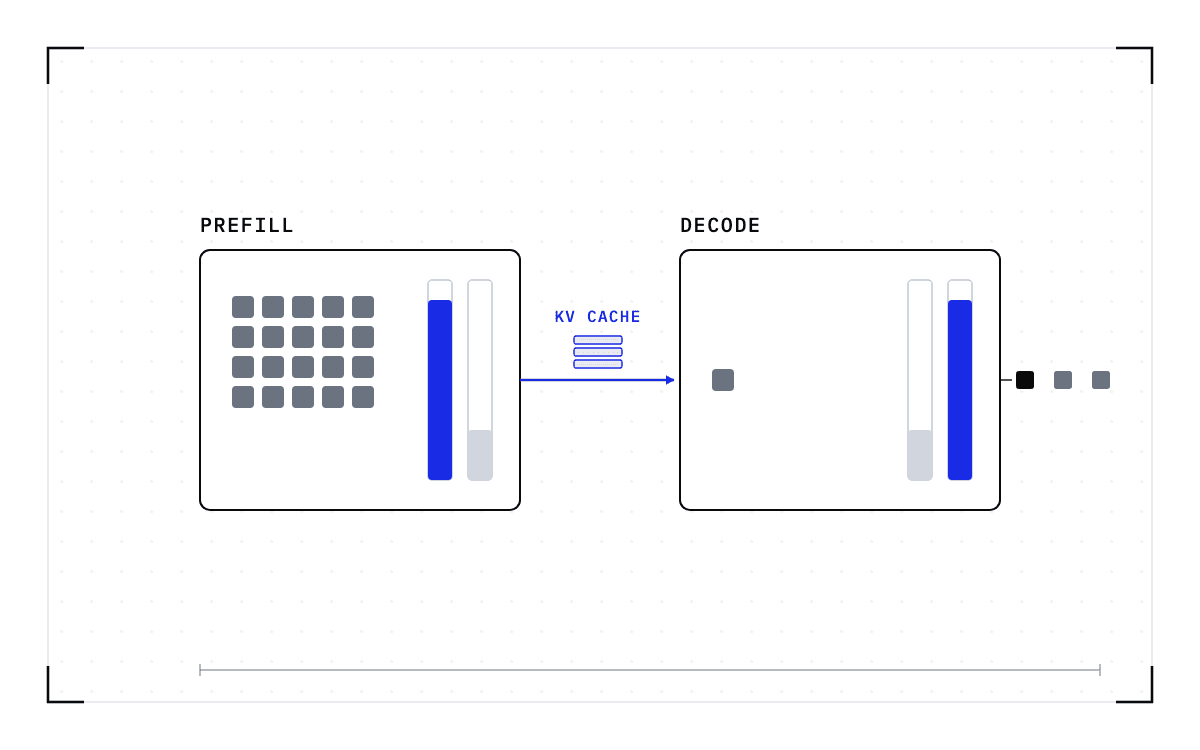
Cedana. Blueprint of two machines. The left one holds a block of twenty small grey squares and two vertical gauges, the first filled blue to the top and the second barely filled. A blue arrow carrying three thin stacked bars crosses to the right machine, which holds one small square and gauges filled the opposite way. Three single squares trail out of its right side.One model, two workloads: prefill, decode, and why disaggregation exists

One model, two workloads: prefill, decode, and why disaggregation exists

Understand prefill and decode resource needs, the KV-cache transfer cost of separating them, and how your traffic changes the right balance between serving pools.

read →
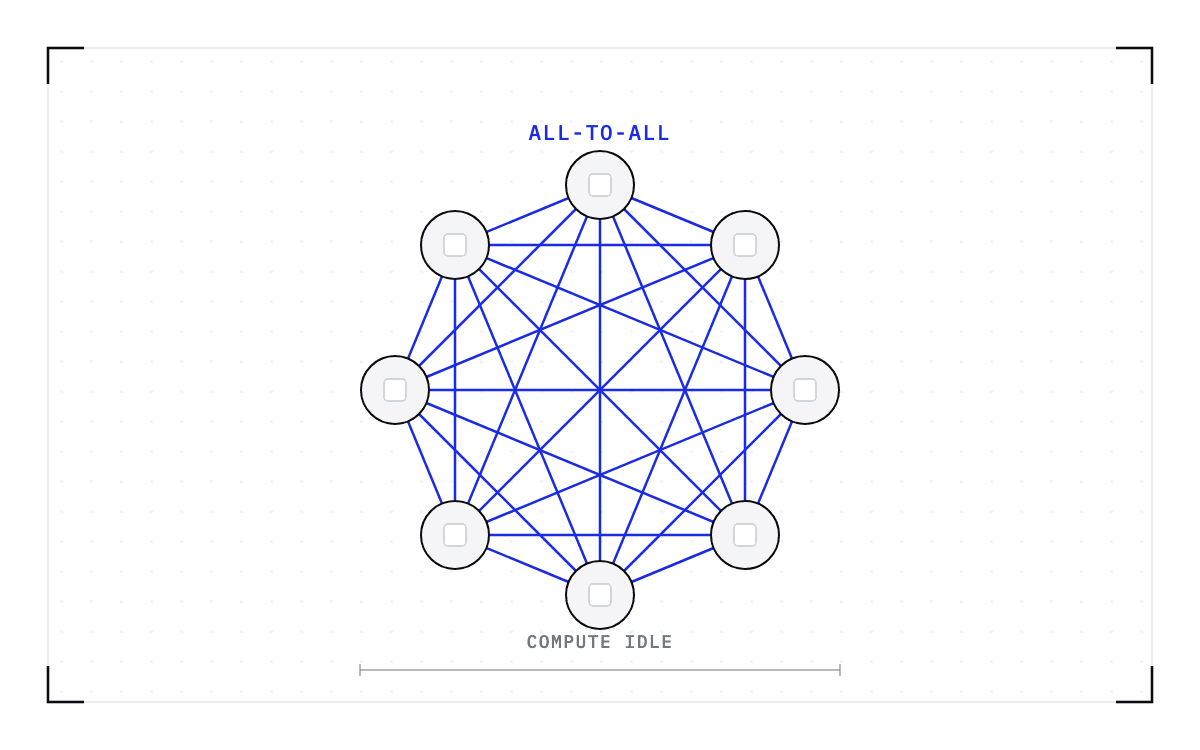
Cedana. Blueprint of eight circles arranged in a ring, each with a small empty square inside. Every circle is joined to every other by a straight blue line, so the middle of the ring is a dense blue mesh while the circles themselves are pale and empty.MoE serving is a network problem, and more GPUs will not fix it

MoE serving is a network problem, and more GPUs will not fix it

Diagnose compute, memory and interconnect limits in MoE inference. See why activated parameter counts and extra GPUs cannot replace communication measurements.

read →
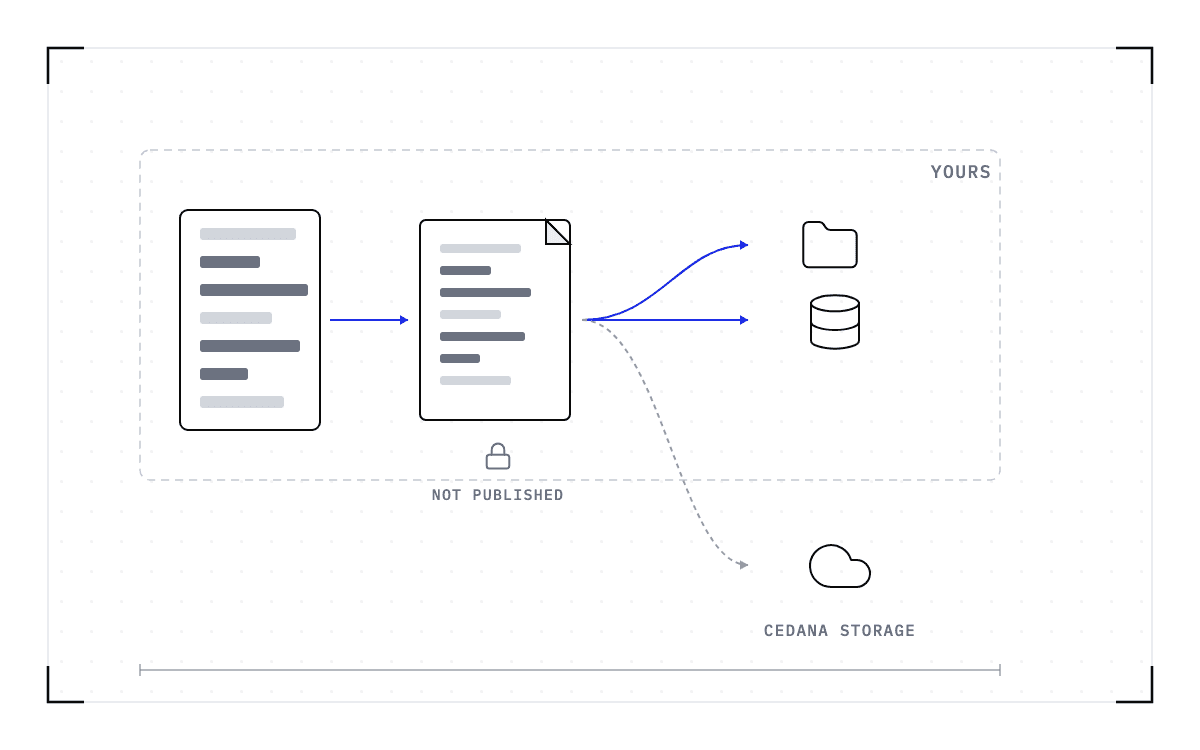
Cedana. Blueprint of a memory block with grey stripes copied by a blue arrow into a document with the same stripes. From the document, two blue arrows go to a folder and to a bucket inside a large dashed boundary, and a grey dashed arrow leaves the boundary to a cloud shape below it. A small dashed padlock sits under the document.Where checkpoints live, how long they stay, and who can read them

Where checkpoints live, how long they stay, and who can read them

Choose where GPU checkpoints live, how long they remain and who can read them. Identify the encryption and key-management answers a security review still needs.

read →
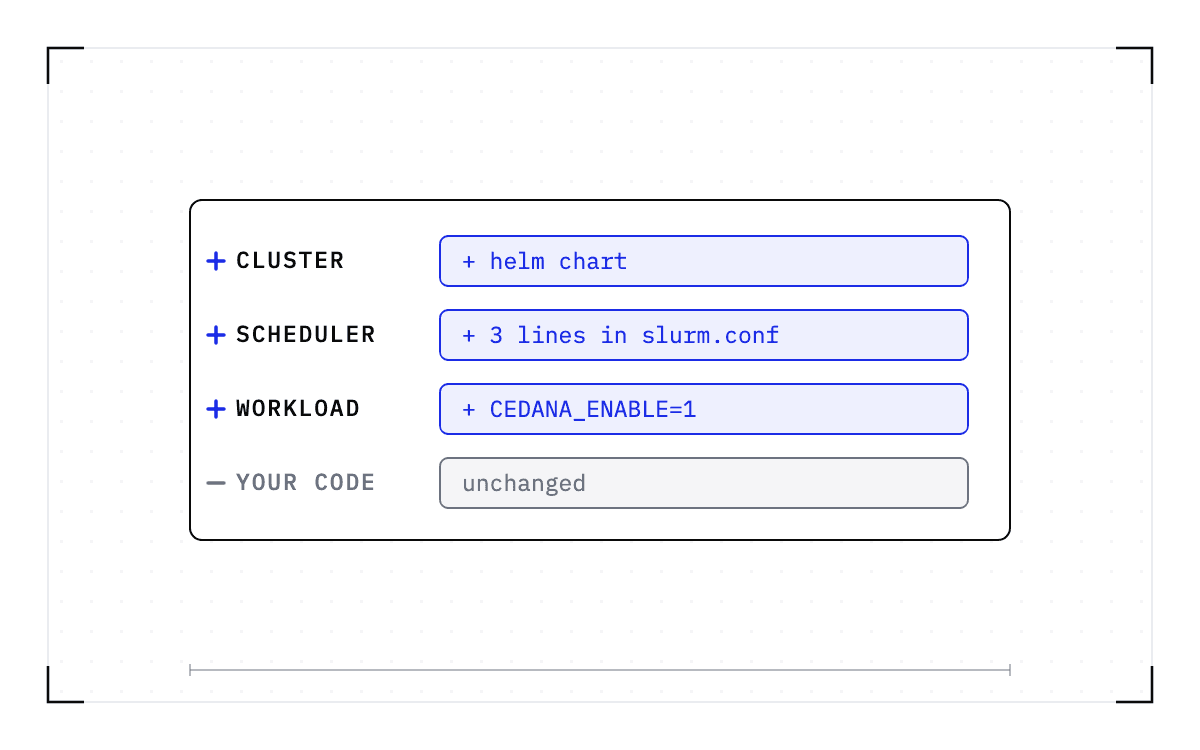
Cedana. Blueprint of a bordered panel holding four rows. Three rows, marked with a blue plus and labelled cluster, scheduler and workload, carry blue chips reading plus helm chart one daemonset, plus three lines in slurm.conf, and plus CEDANA_ENABLE equals one. The fourth row, marked with a grey minus and labelled your code, carries a grey chip reading unchanged.What actually changes on my cluster when I install Cedana?

What actually changes on my cluster when I install Cedana?

Review the Helm install, Slurm plugins and workload opt-in settings Cedana adds to a cluster, with configuration examples and the application-code boundary.

read →
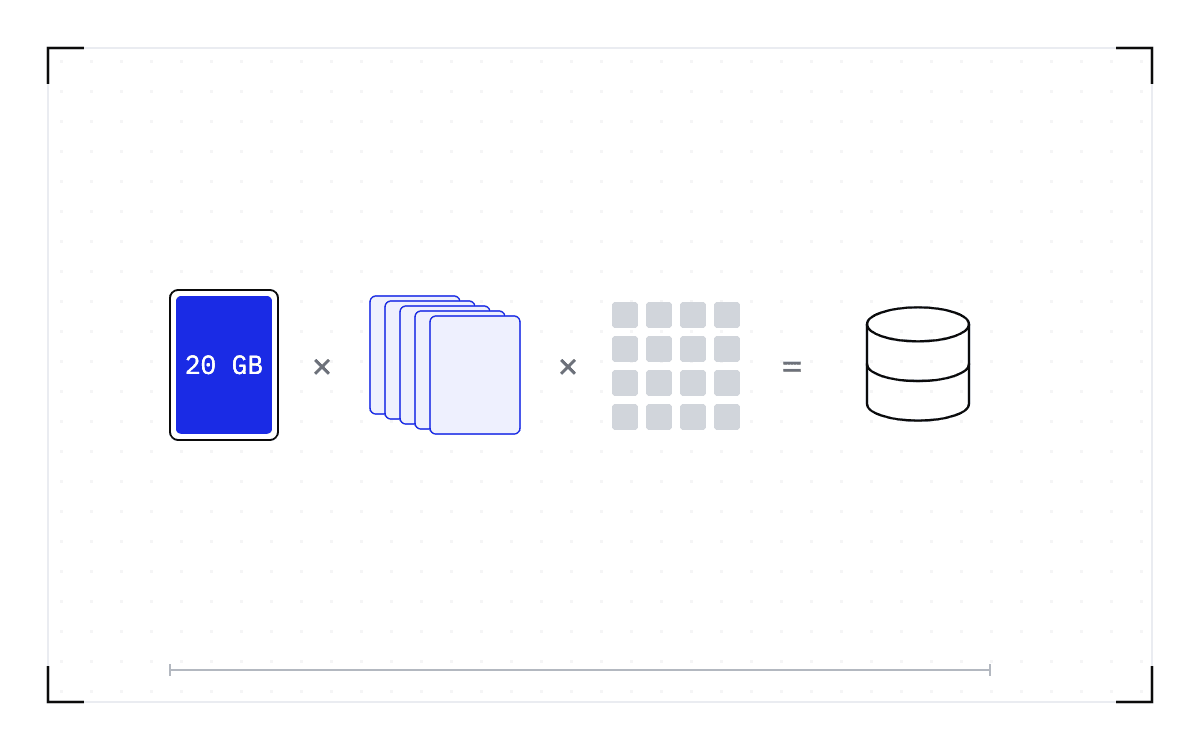
Cedana. Blueprint of a multiplication written in shapes across the frame: a blue block marked twenty gigabytes, times a stack of five pale blue copies, times a grid of sixteen small squares, equals a database cylinder.How much storage does checkpointing a GPU cluster need?

How much storage does checkpointing a GPU cluster need?

Estimate checkpoint storage from workload memory, retained copies and job count. Review quota controls, storage bandwidth and unanswered lifecycle behaviors.

read →
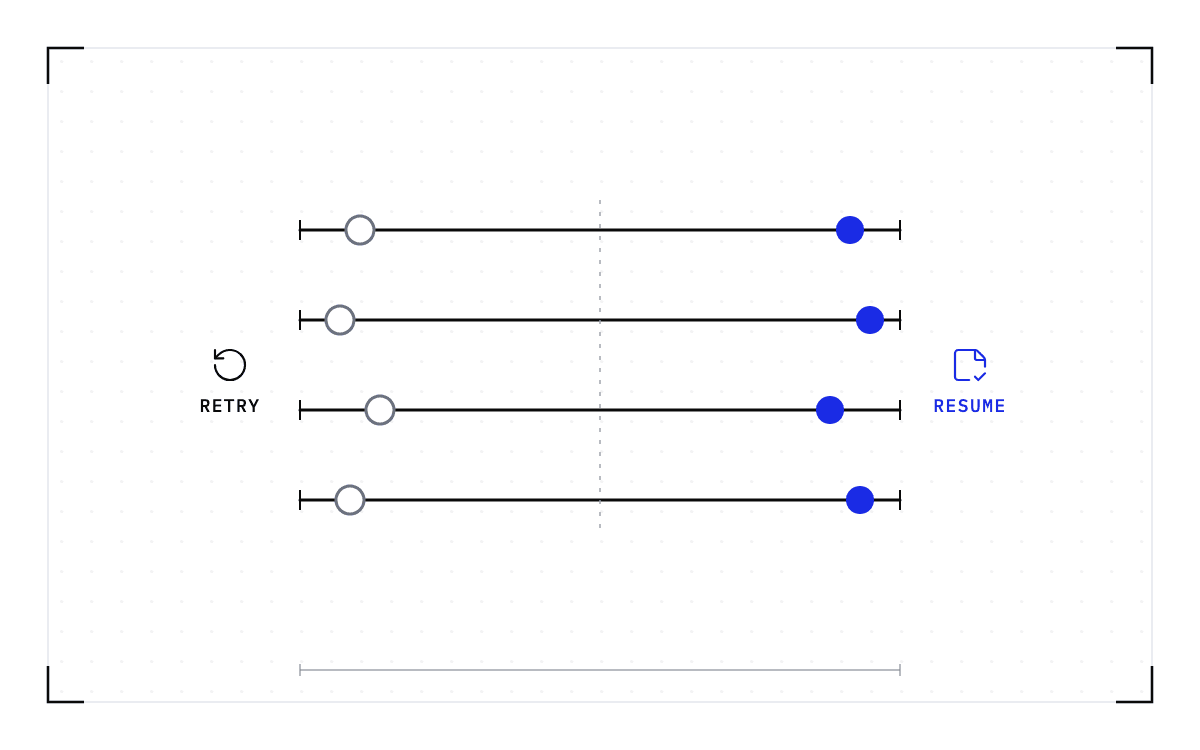
Cedana. Blueprint of four horizontal slider tracks with end stops, a faint dashed line at their midpoint, a circular restart arrow at the left end and a saved-state icon at the right. On every track a hollow grey knob sits near the left and a solid blue knob sits near the right.When retrying the job is the right call

When retrying the job is the right call

Decide whether a GPU job needs checkpoints using interruption risk, work at stake, rebuild cost and deadline slack. Keep application idempotency in either path.

read →
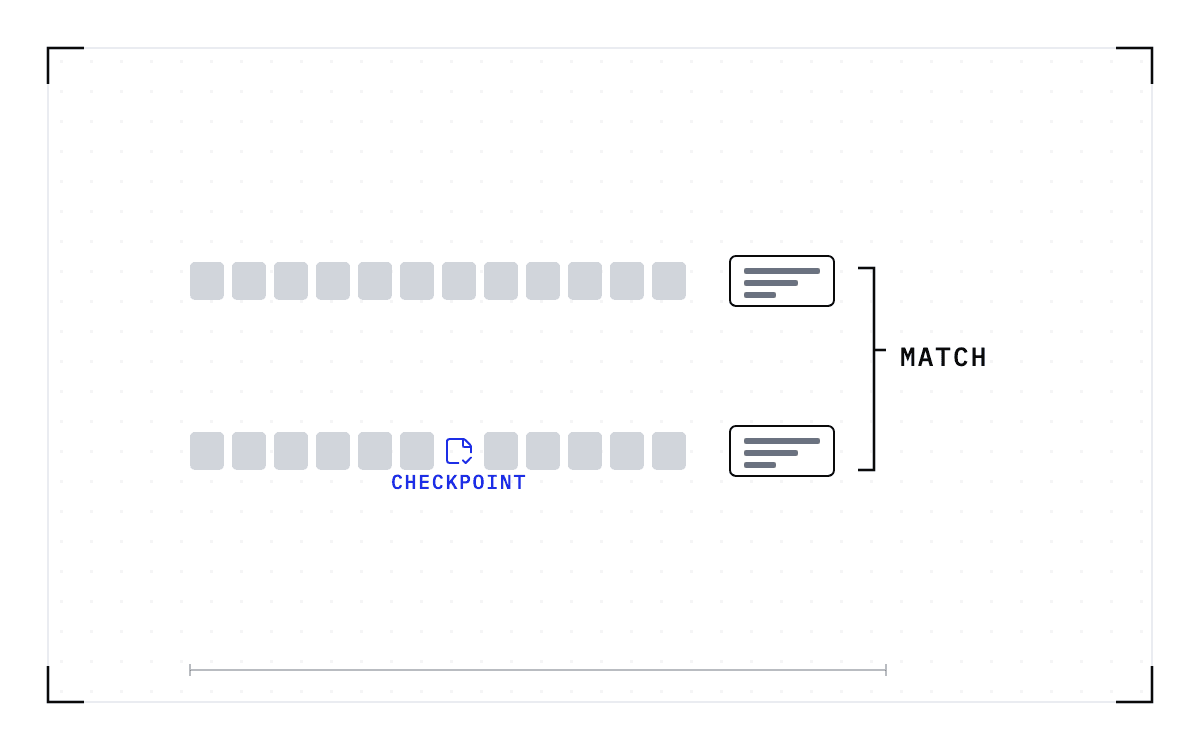
Cedana. Blueprint of two rows of small grey blocks, each ending in an outlined output box. The top row is unbroken. The second has one block replaced by a blue save icon marked checkpoint. A bracket joins the two output boxes and the word match sits beside it.How to know a restored GPU workload is correct

How to know a restored GPU workload is correct

Test whether a restored GPU workload continues the same computation. Compare repeatable runs, check multi-GPU boundaries and record the exact environment.

read →
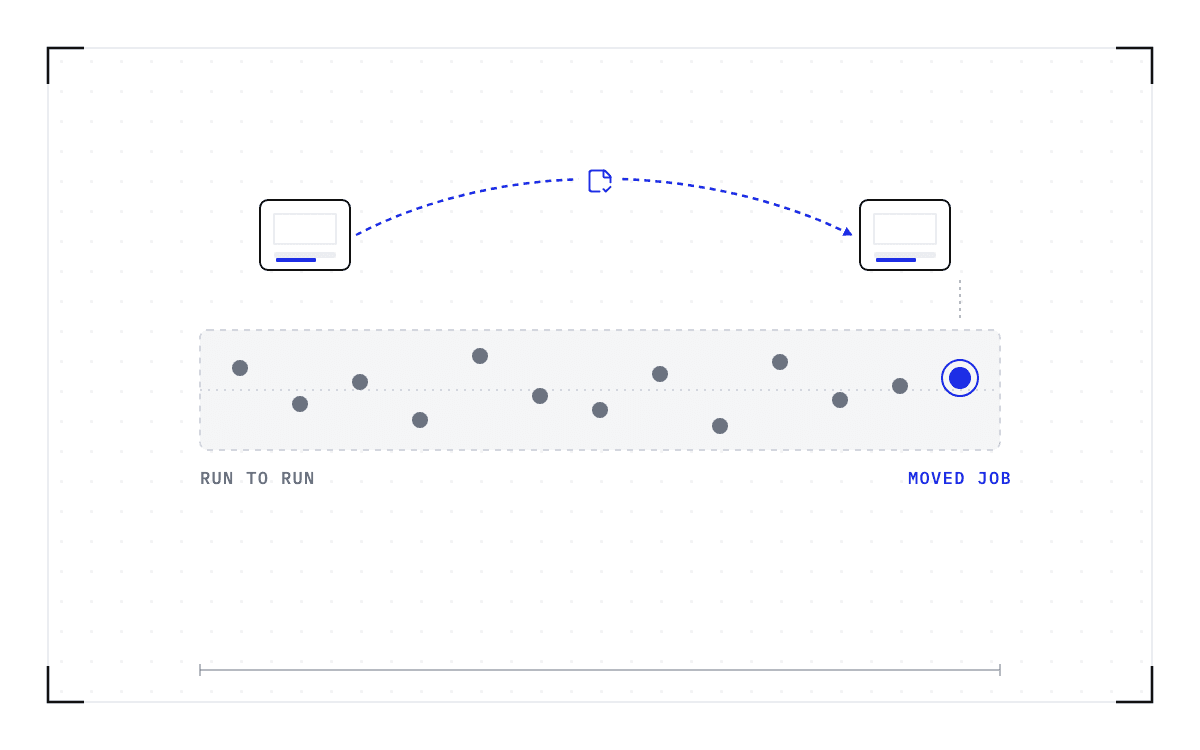
Cedana. Blueprint of two identical GPU cards at the top joined by a blue dashed arc carrying a saved-state icon. Beneath them a wide dashed band with a faint centre line holds a dozen dark grey dots scattered at different heights, and near its right end one blue dot with a ring around it sits inside the band, under the second card.Does moving a job change its results?

Does moving a job change its results?

Understand what a checkpoint preserves when a GPU job moves, which versions must match, and how live inputs and ordinary GPU variation affect reproducibility.

read →
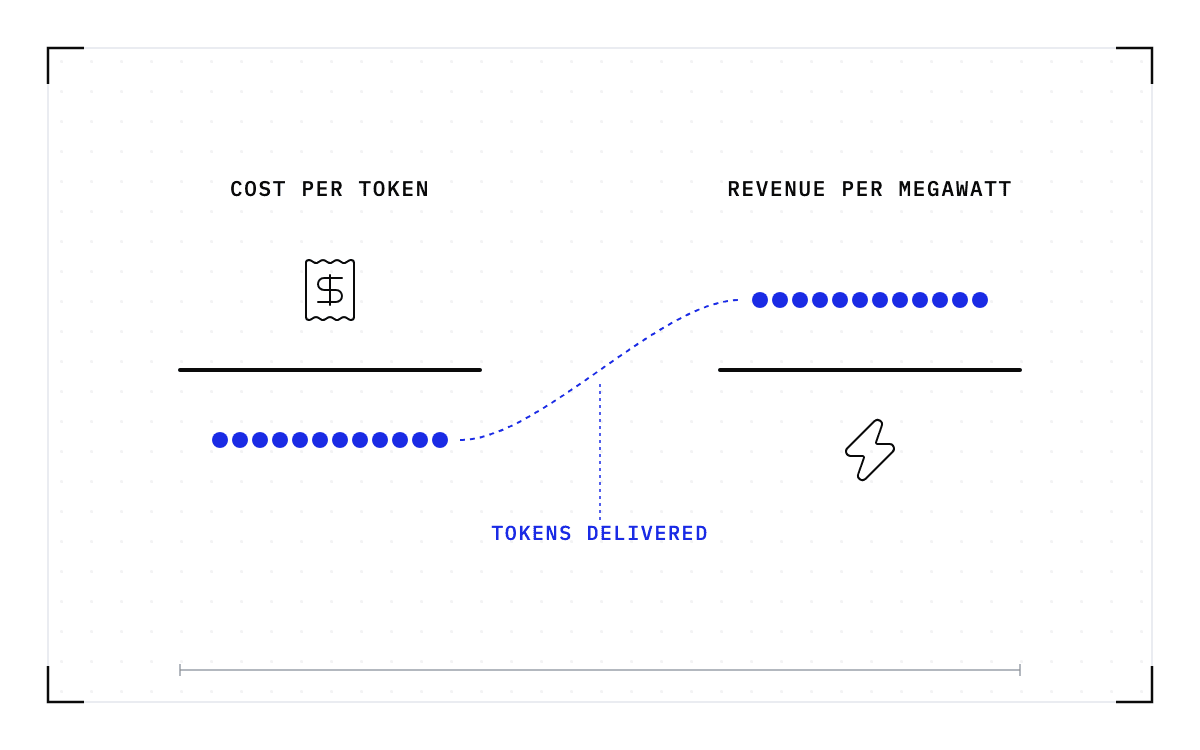
Cedana. Blueprint of two fractions. On the left, marked cost per token, a receipt icon sits over a line with a row of twelve blue dots beneath. On the right, marked revenue per megawatt, the same row of blue dots sits over a line with a lightning icon beneath. A blue dashed curve joins the two rows of dots, marked tokens delivered.Cost per token and revenue per megawatt are the same number

Cost per token and revenue per megawatt are the same number

Calculate cost per delivered token from fleet costs and serving logs, then see how cold starts, failures and stranded capacity also affect revenue per megawatt.

read →
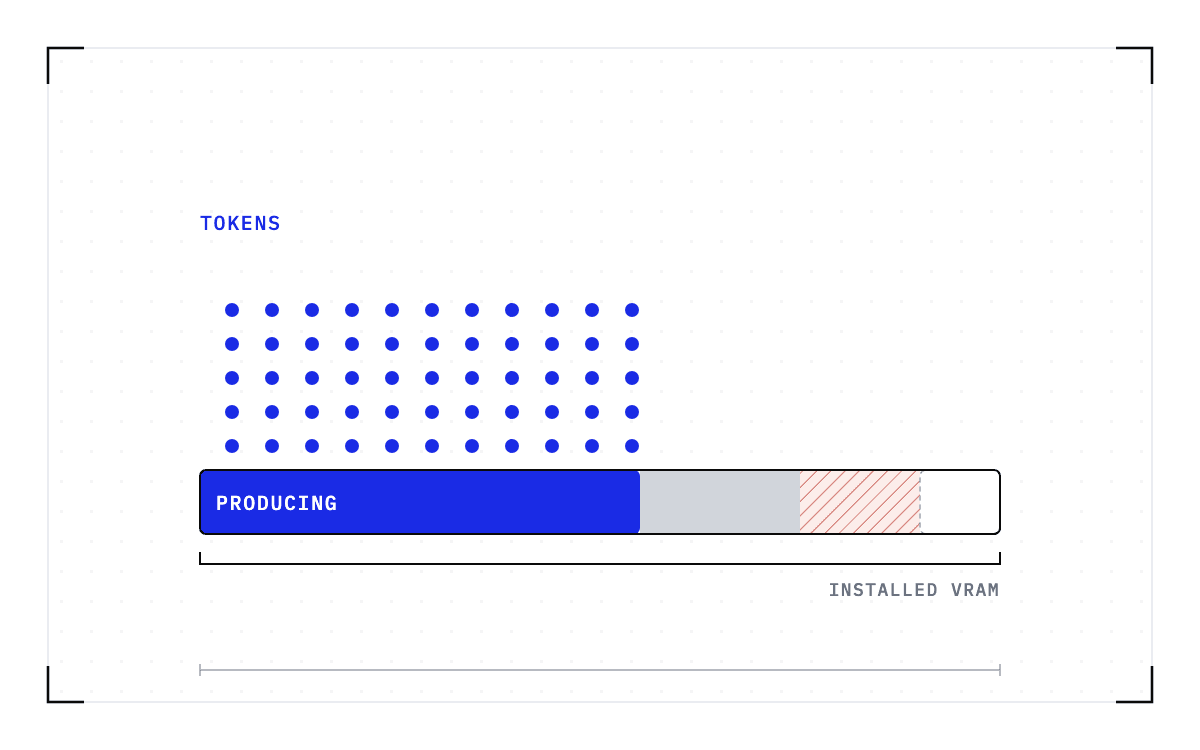
Cedana. Blueprint of one long horizontal bar under a bracket: its left half solid blue with columns of small blue dots rising above it, then a grey segment, then a red-hatched segment, then a dashed empty segment at the right, with nothing rising above any of those three.The fleet's real yield metric is tokens per gigabyte of VRAM

The fleet's real yield metric is tokens per gigabyte of VRAM

Measure delivered tokens against installed VRAM. See how memory bandwidth, warm replicas, failures and stranded GPUs affect the output of an inference fleet.

read →
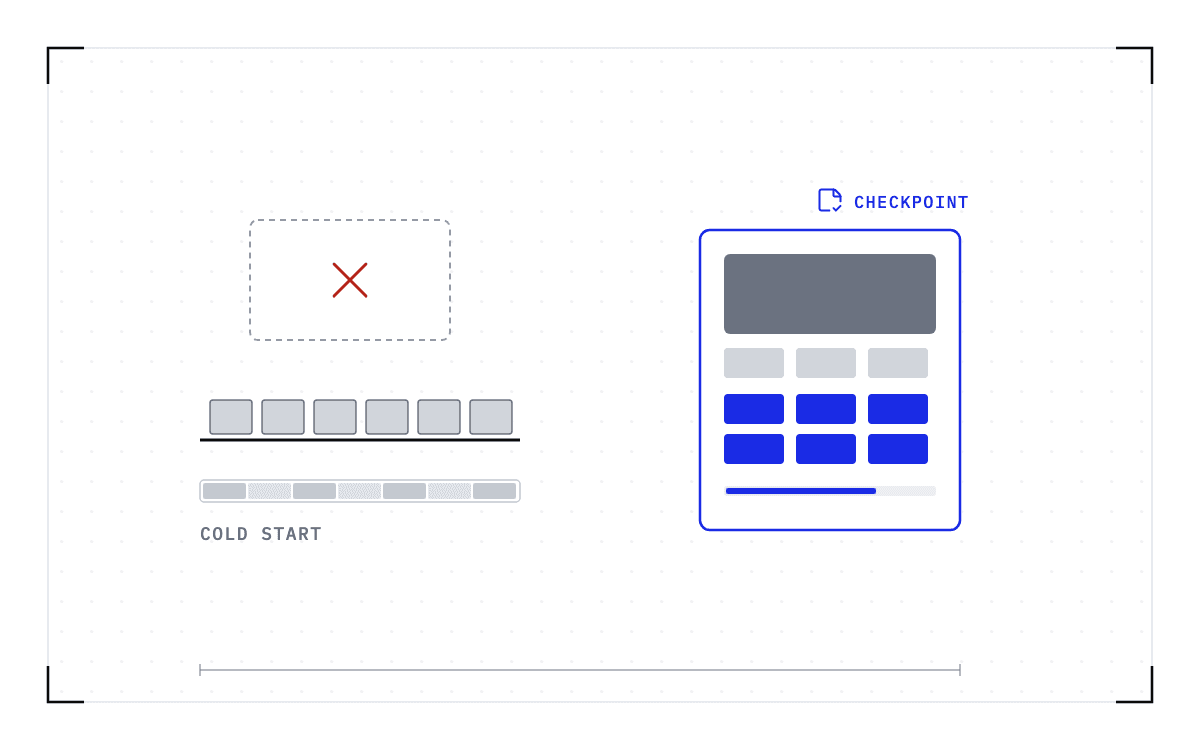
Cedana. Blueprint of a dashed worker outline struck out in red above a shelf holding six grey cache blocks, with a long segmented grey bar beneath the shelf leading to a small dashed outline. On the right a large worker outlined in blue, with a saved-state icon above it, holds a dark weights block, three small grey blocks, and six blue cache blocks inside.KV-cache offload versus a saved worker: what each survives

KV-cache offload versus a saved worker: what each survives

Compare the state preserved by KV-cache offload and a full worker checkpoint. Learn what survives a crash, what must reload, and where prefix reuse still helps.

read →
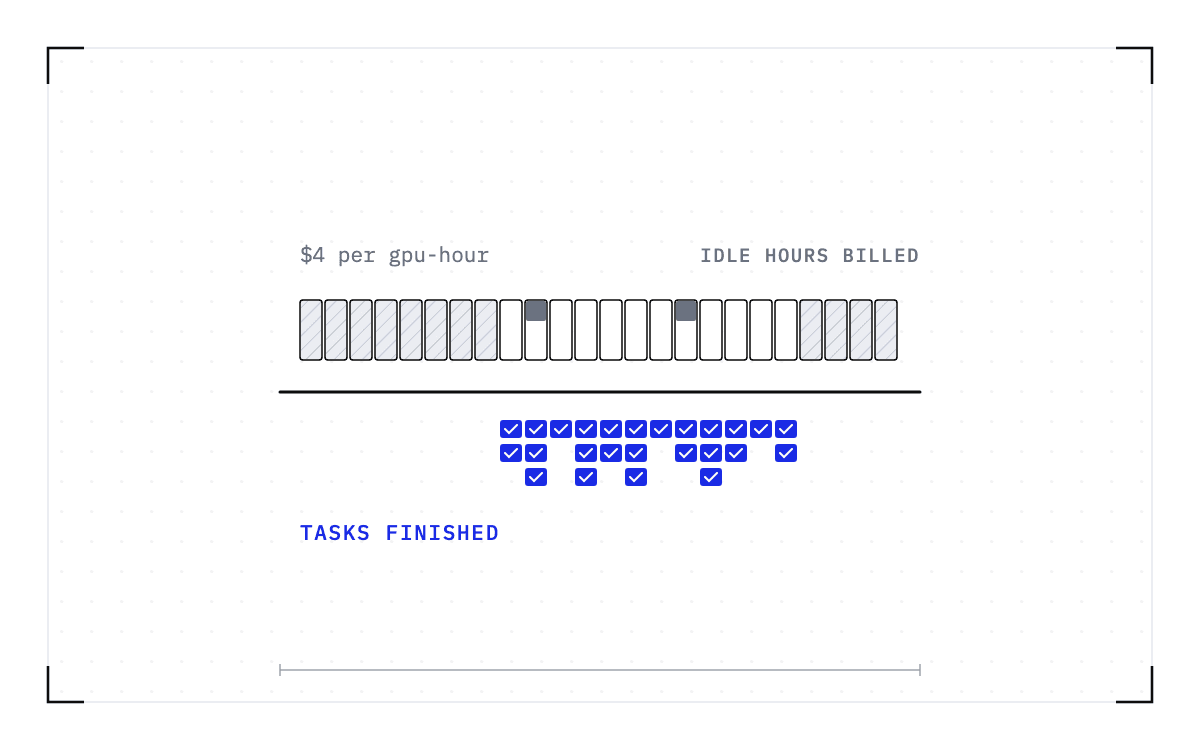
Cedana. Blueprint of a fraction. Above the line, twenty-four small outlined boxes marked four dollars per GPU-hour, twenty-four hours billed, the first eight and last four hatched grey and two of the middle ones capped dark. Below the line, columns of blue ticked squares marked tasks finished stand under the middle boxes only.Tasks per dollar: the economics of running your own coding models

Tasks per dollar: the economics of running your own coding models

Compare coding APIs and self-hosted GPUs using cost per completed task. Account for idle node hours, model swaps and task completion on your own traffic.

read →
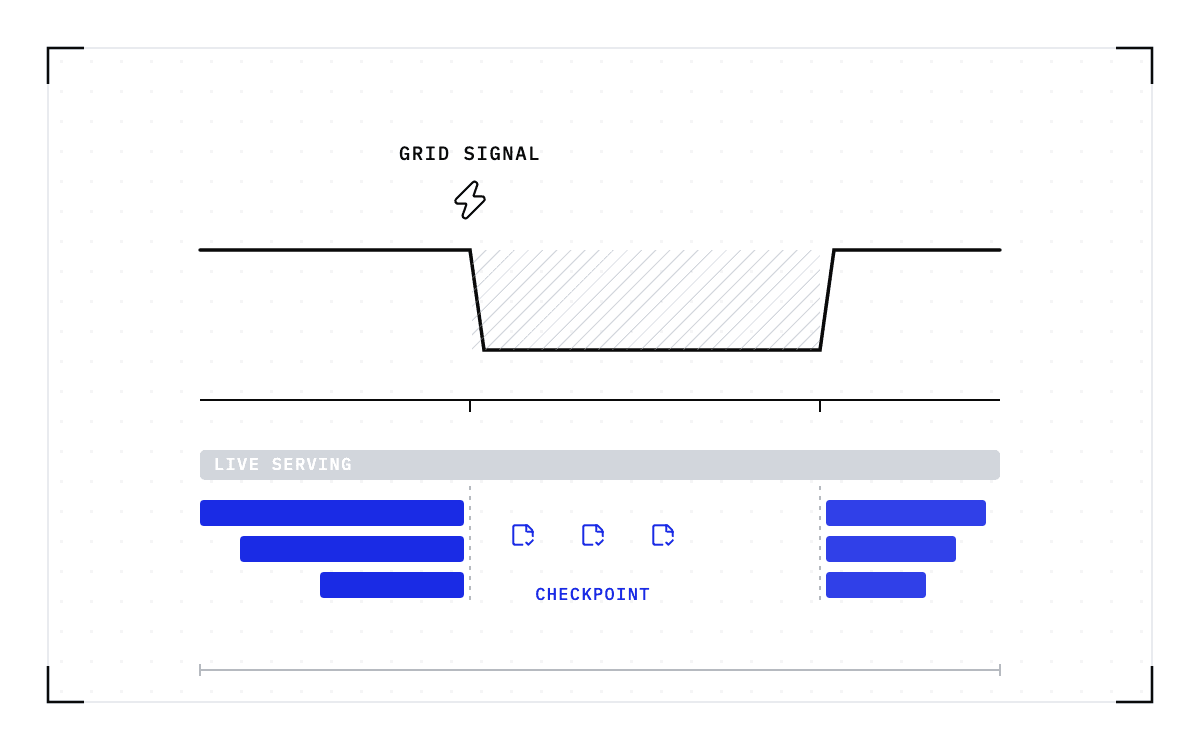
Cedana. Blueprint of a power line running flat, stepping down at a bolt-shaped signal, holding a lower level with the reduction hatched beneath the original line, then stepping back up. Under it a grey band runs unbroken across the whole width, and beneath that three blue bars stop at the signal, three saved-state icons sit in the gap, and the bars resume at the return.Demand response for GPU fleets: what the programs require

Demand response for GPU fleets: what the programs require

Review two GPU demand response trials, the workloads they could flex, and why deeper power cuts require saved job state. Separate trial results from design targets.

read →
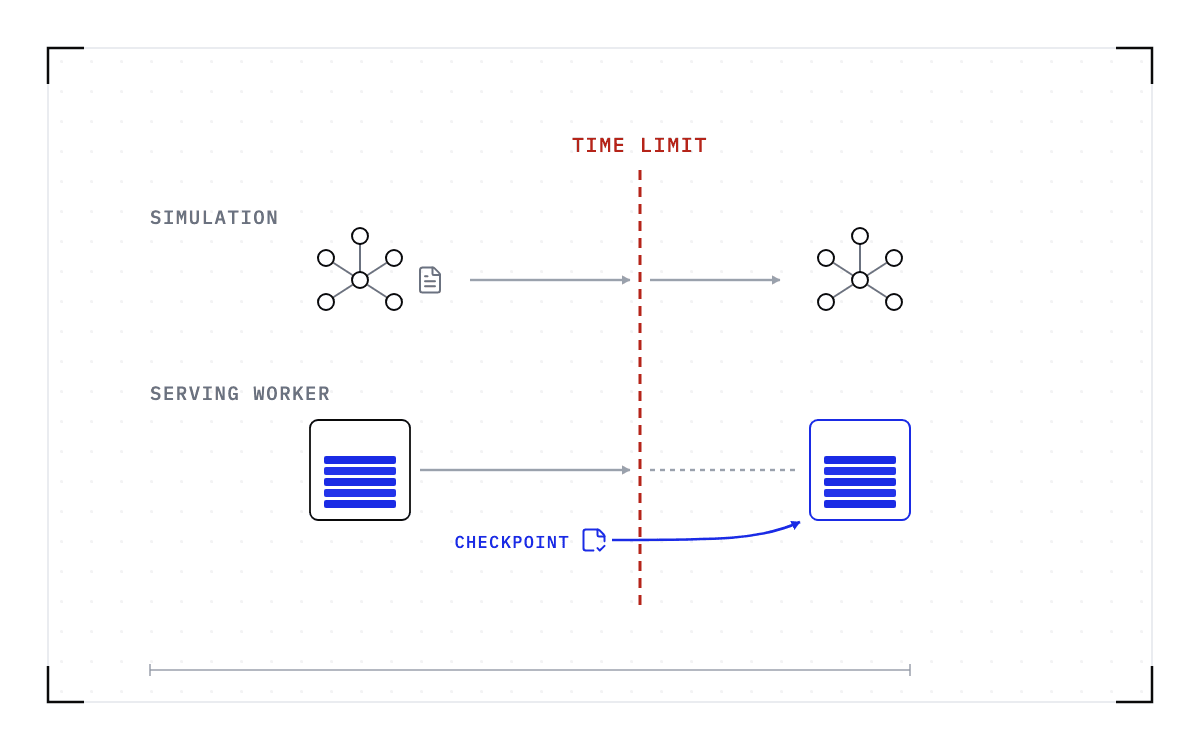
Cedana. Blueprint of a red dashed vertical line marked time limit with two horizontal lanes crossing it. In the upper lane, marked simulation, a small molecule of joined circles carries a document past the line and appears whole on the far side. In the lower lane, marked serving worker, a GPU worker stacked with blue slabs approaches the line and only a dashed outline stands beyond it, except that a save icon marked checkpoint below the line sends a blue arrow to a second worker outlined in blue with its slabs intact.Stateful AI has the same boundary problem as long HPC runs

Stateful AI has the same boundary problem as long HPC runs

See why inference, fine-tuning and agent workloads face the same allocation limits as HPC simulations, but carry different state and recovery obligations.

read →
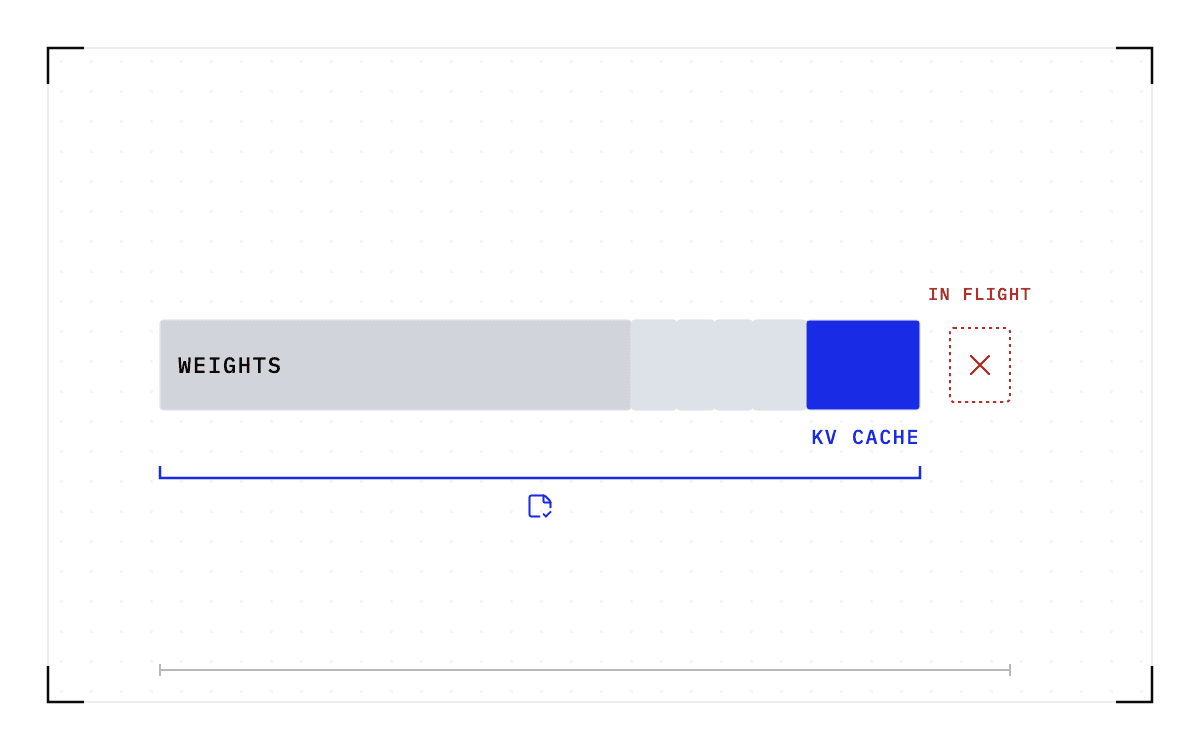
Cedana. Blueprint of one wide bar divided by bytes: a large grey block marked weights, four small pale segments, and a solid blue segment at the right marked kv cache. Just past the bar's end a small red dashed square with a cross floats, marked in flight. A blue bracket under the bar spans everything, with a save icon at its centre.What is inside a GPU checkpoint?

What is inside a GPU checkpoint?

See the weights, KV cache, CUDA context and process state inside a GPU checkpoint, how they affect its size, and what a restart has to rebuild.

read →
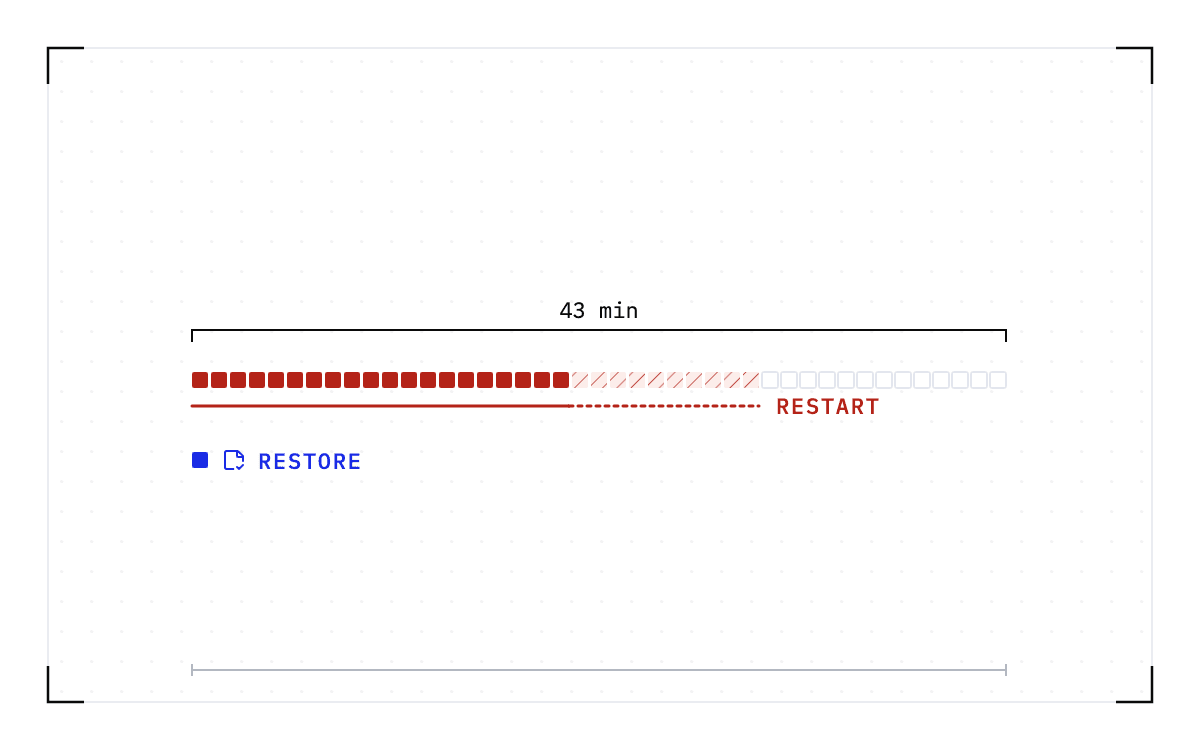
Cedana. Blueprint of a row of forty-three small squares under a bracket that spans them all: the first twenty solid red, the next ten red-hatched, the rest empty outlines. Below the row a red line runs under the twenty and continues dashed under the ten. Further down, a single blue square sits beside a saved-state icon.One frontier restart burns half a monthly 99.9% error budget

One frontier restart burns half a monthly 99.9% error budget

Calculate how model restart time consumes an inference error budget, what replicas change, and how to compare a measured restore with your availability SLO.

read →
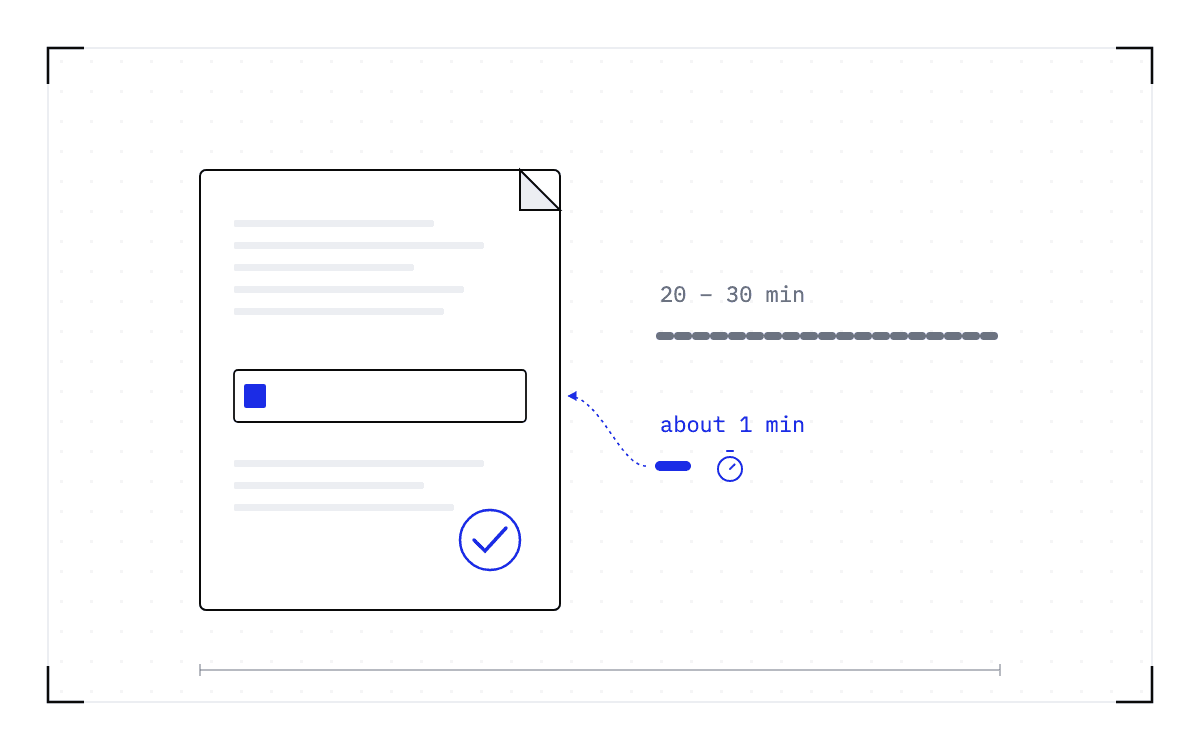
Cedana. Blueprint of a document with a folded corner, ruled lines, one boxed field holding a short blue mark, and a blue circled tick. To the right, two candidates for the field: a long grey dashed bar marked twenty to thirty minutes, and a very short blue bar beside a timer icon marked about one minute, from which a thin blue line leads back into the field.The recovery time you can put in a filing

The recovery time you can put in a filing

Define and test LLM recovery time from failure to serving again. Separate restore benchmarks from the detection, placement and recovery your team must document.

read →
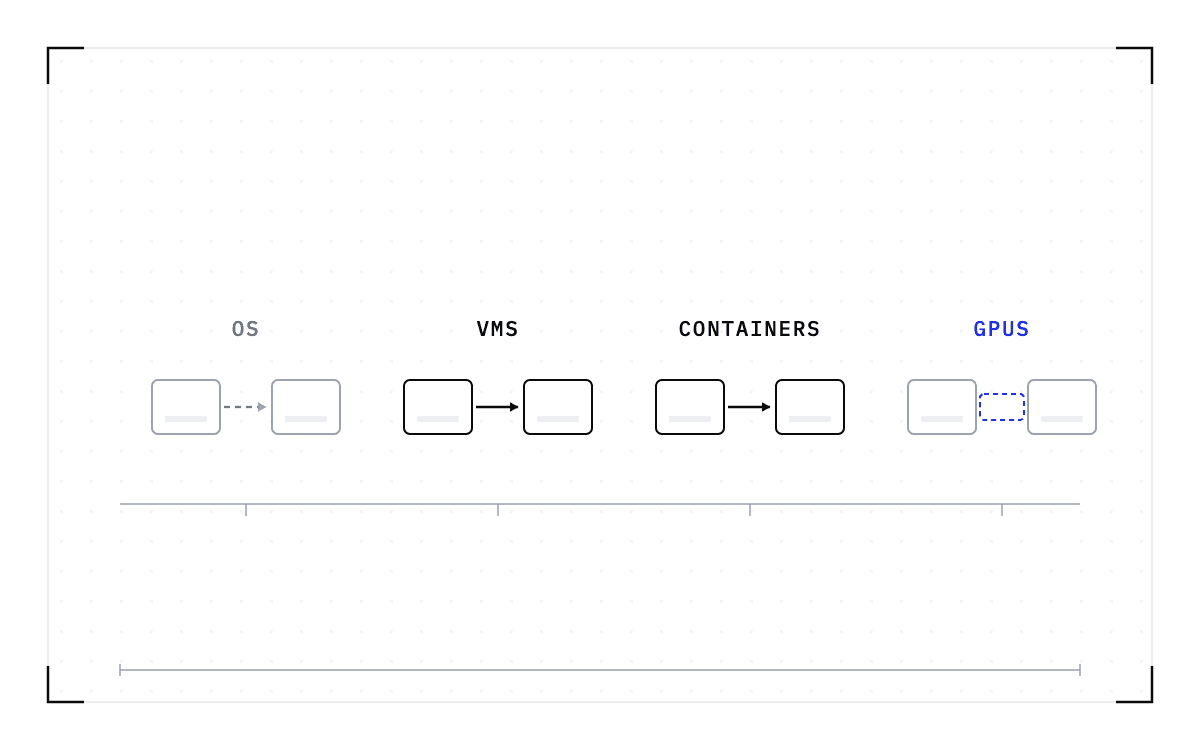
Cedana. Blueprint of four columns on one timeline, each holding two small machine boxes: a grey dashed arrow between them under os, solid arrows under vms and containers, and under gpus an empty blue dashed slot.Every era of computing needed a migration primitive. GPUs are next

Every era of computing needed a migration primitive. GPUs are next

Trace migration through operating systems, virtual machines, containers and databases to understand why GPU fleets need portable running state.

read →
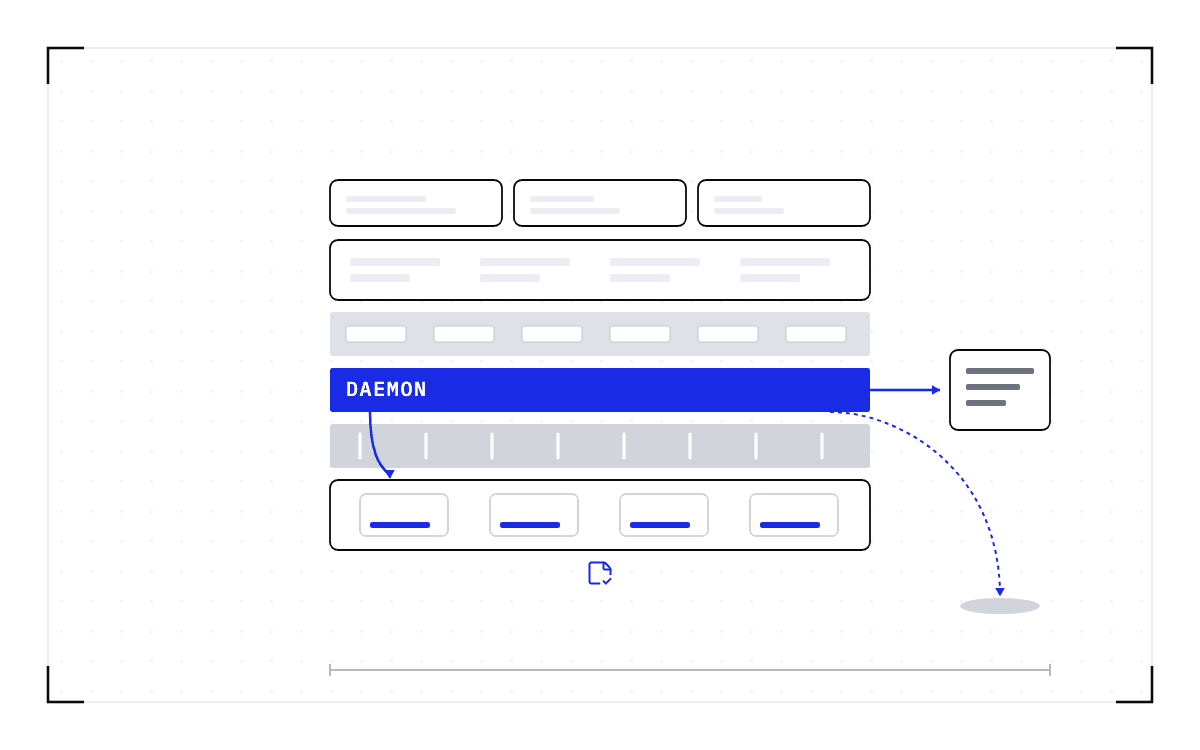
Cedana. Blueprint of a node in cross-section: three engine boxes on top, a wide process band beneath them, a runtime band of small tiles, then one solid blue band, then a darker kernel band, then a driver band holding four GPU cells with blue status bars. From the blue band one arrow drops into the driver band, one leads right to a process box outside the stack, and a dashed line carries a saved-state icon down to a storage disc.How Cedana works: checkpoint, restore, and migration below the serving engine

How Cedana works: checkpoint, restore, and migration below the serving engine

Explore Cedana's daemon, CRIU and GPU capture layers, the state they restore, and the policies, storage paths and compatibility limits around them.

read →
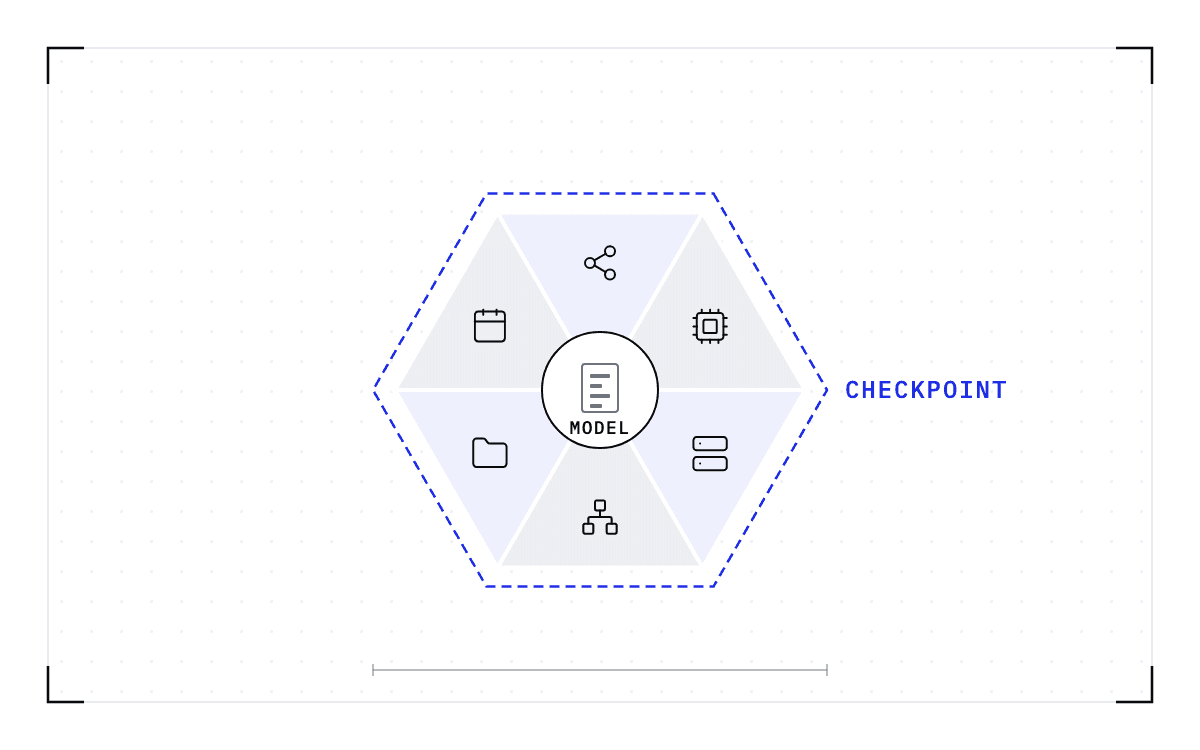
Cedana. Blueprint of a hexagon cut into six wedges in alternating pale blue and grey, each holding a small line glyph: a GPU card, a chip, two joined dots, a folder, three list lines, a triangle of dots. At the centre a white circle holds one small grey document. A blue dashed outline runs around the whole hexagon.What is GPU checkpointing? A plain explanation

What is GPU checkpointing? A plain explanation

Learn what GPU checkpointing saves, how checkpoint, snapshot, restore and migration differ, and why saving model weights alone cannot resume a workload.

read →
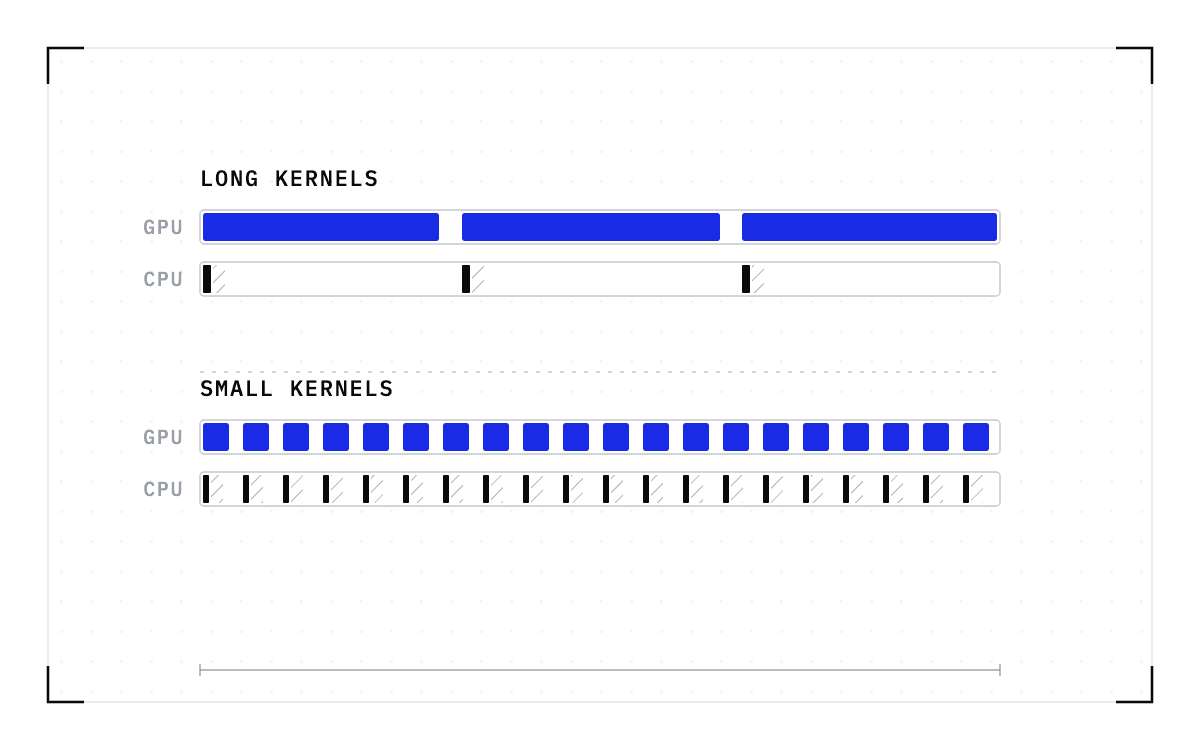
Cedana. Blueprint of two pairs of horizontal lanes. In the upper pair the top lane holds three long blue blocks and the lane beneath is almost empty, with a thin black tick and a small hatched sliver at the start of each block. In the lower pair the top lane holds twenty short blue blocks and the lane beneath is crowded with a tick and a hatched sliver under every one.What a GPU checkpointing layer costs while the workload runs

What a GPU checkpointing layer costs while the workload runs

Understand steady-state GPU checkpointing overhead, why driver-call patterns matter, and what Cedana's published single-GPU measurements leave unanswered.

read →
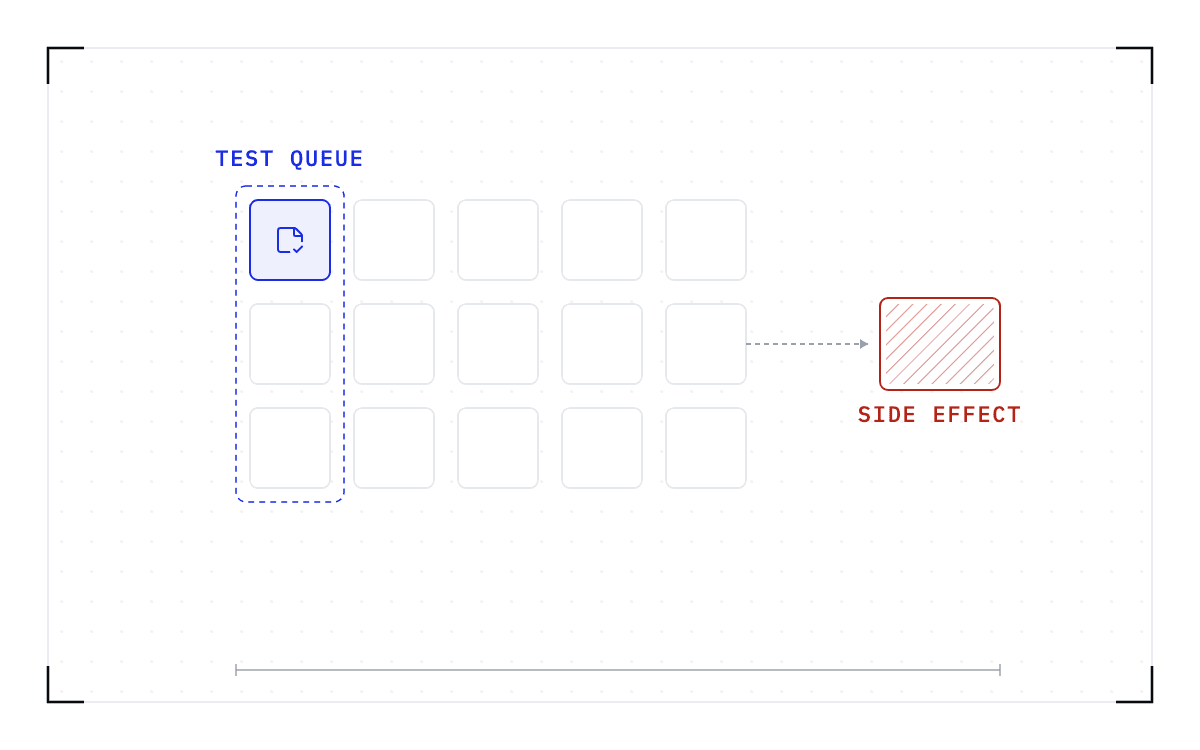
Cedana. Blueprint of three rows of five outlined tiles. The first column is enclosed in a dashed blue fence and its top tile is tinted blue with a saved-state icon. From the right-hand tile of the middle row a grey dashed arrow leads out to a red-outlined box filled with red diagonal hatching.Which GPU workloads should I checkpoint first, and which should I leave alone?

Which GPU workloads should I checkpoint first, and which should I leave alone?

Choose a small first workload set for GPU checkpointing. Review opt-in controls, cheap retries, real-time inputs, external side effects and untested job servers.

read →
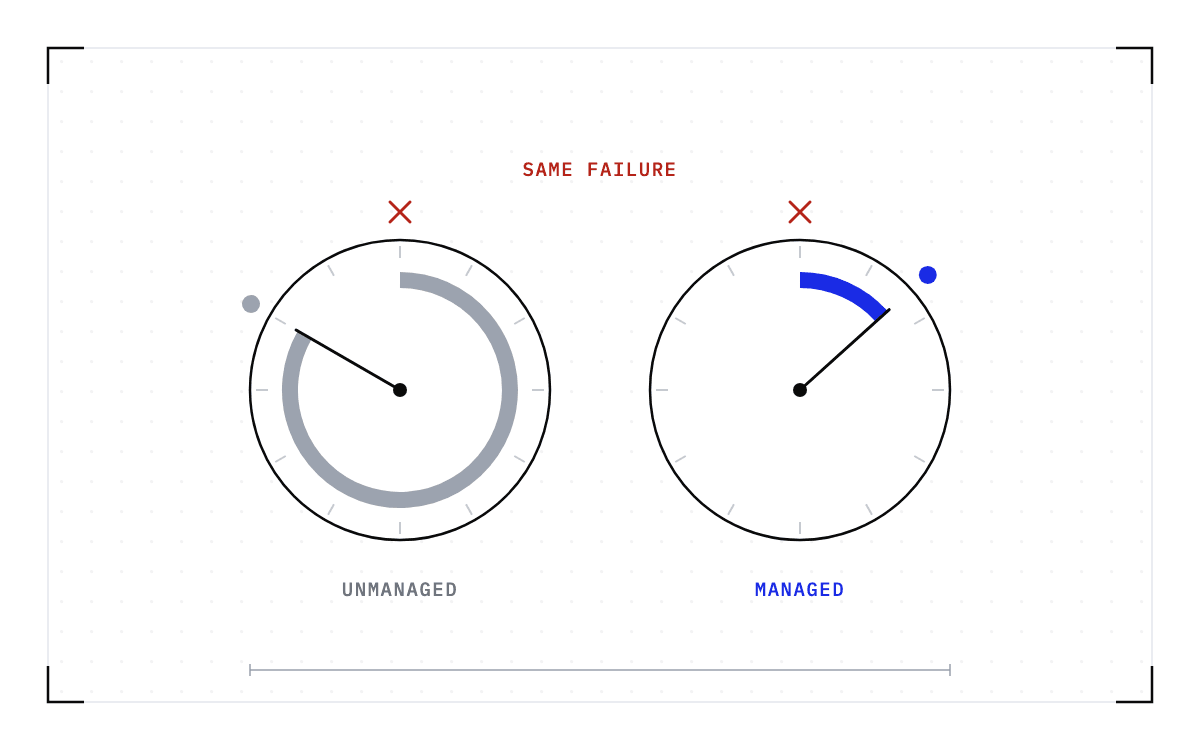
Cedana. Blueprint of two identical clock faces side by side, each with a red cross above twelve o'clock. On the left the sweep is a thick grey arc running most of the way around with the hand near ten o'clock. On the right the sweep is a short thick blue arc and the hand sits just past one o'clock. A dot marks the end of each sweep outside the rim.How do I run a proof of concept for GPU checkpointing?

How do I run a proof of concept for GPU checkpointing?

Plan a GPU checkpointing evaluation with a matched baseline, real interruptions, correctness checks and agreed success criteria before expanding the install.

read →
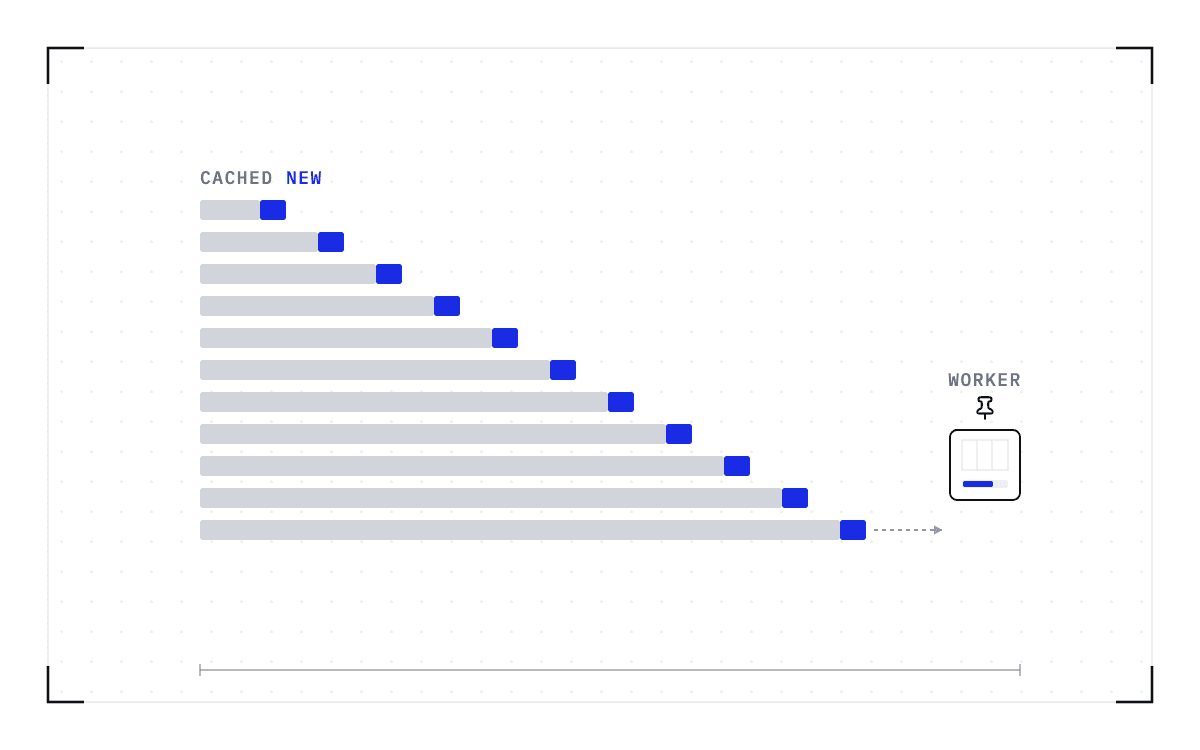
Cedana. Blueprint of eleven horizontal bars stacked top to bottom, each longer than the one above, grey along almost their whole length with a short blue block at the right end of every bar. From the longest bar a grey dashed arrow runs to a small GPU card at the lower right with a black push-pin above it.How long do agentic sessions run, and where does their state live?

How long do agentic sessions run, and where does their state live?

Explore published coding-agent traces to see how turns, cache reuse and pauses shape session affinity, GPU memory use and the cost of a lost worker.

read →
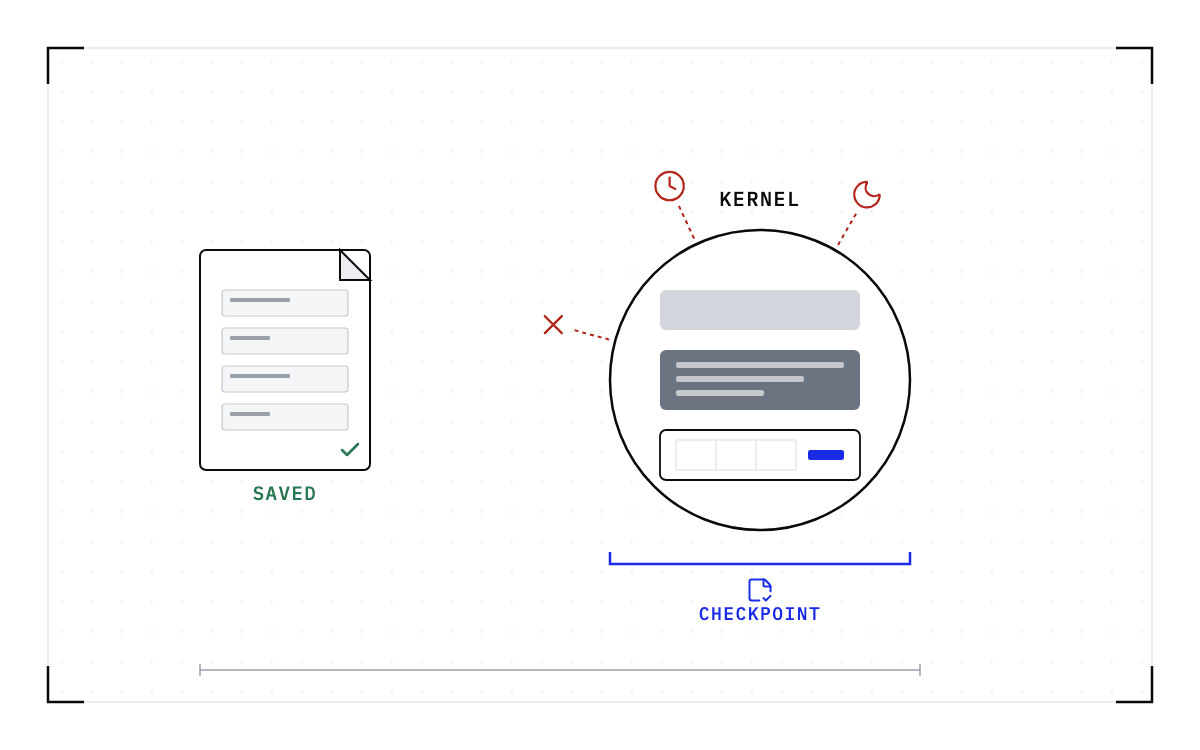
Cedana. Blueprint of a small document on the left with four code cells and a green tick, marked saved, and on the right a large circle marked kernel holding a grey band, a dark block and a GPU card. Three red icons sit around the circle, a cross, a clock and a moon, each joined to it by a red dashed line. A blue bracket spans the circle beneath it with a save icon marked checkpoint.When the node dies under a Jupyter session

When the node dies under a Jupyter session

Learn what a notebook file cannot recover after a GPU node fails, how process checkpoints preserve kernel state, and which restoration limits still apply.

read →
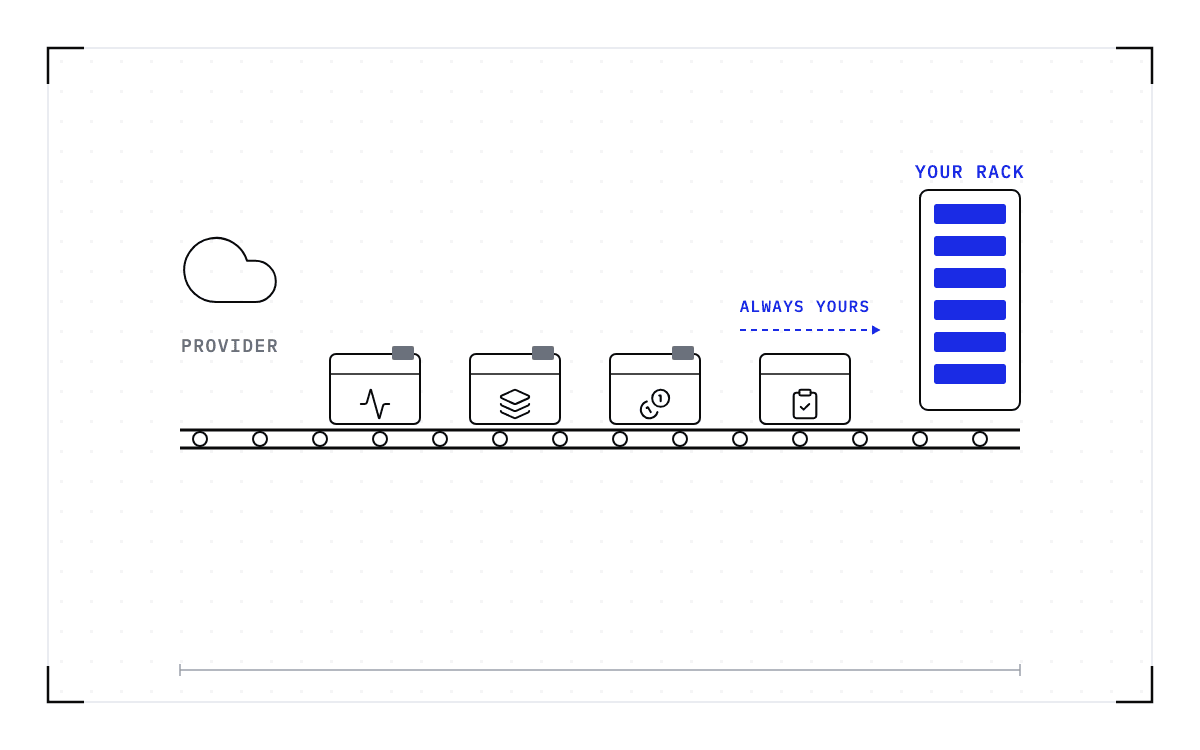
Cedana. Blueprint of a conveyor belt with rollers running from a cloud outline on the left to a tall rack on the right. Four crates ride the belt, each with a small glyph on its face: a heartbeat line, three stacked bars, three coins, a ticked page. The first three carry a small grey tag on their lids; a grey dashed arrow above the belt points toward the rack.Sovereignty has a bill: the transferred duties and the availability math

Sovereignty has a bill: the transferred duties and the availability math

Size the availability responsibilities of running inference on your own hardware, including spare capacity, recovery time and a single node's outage allowance.

read →
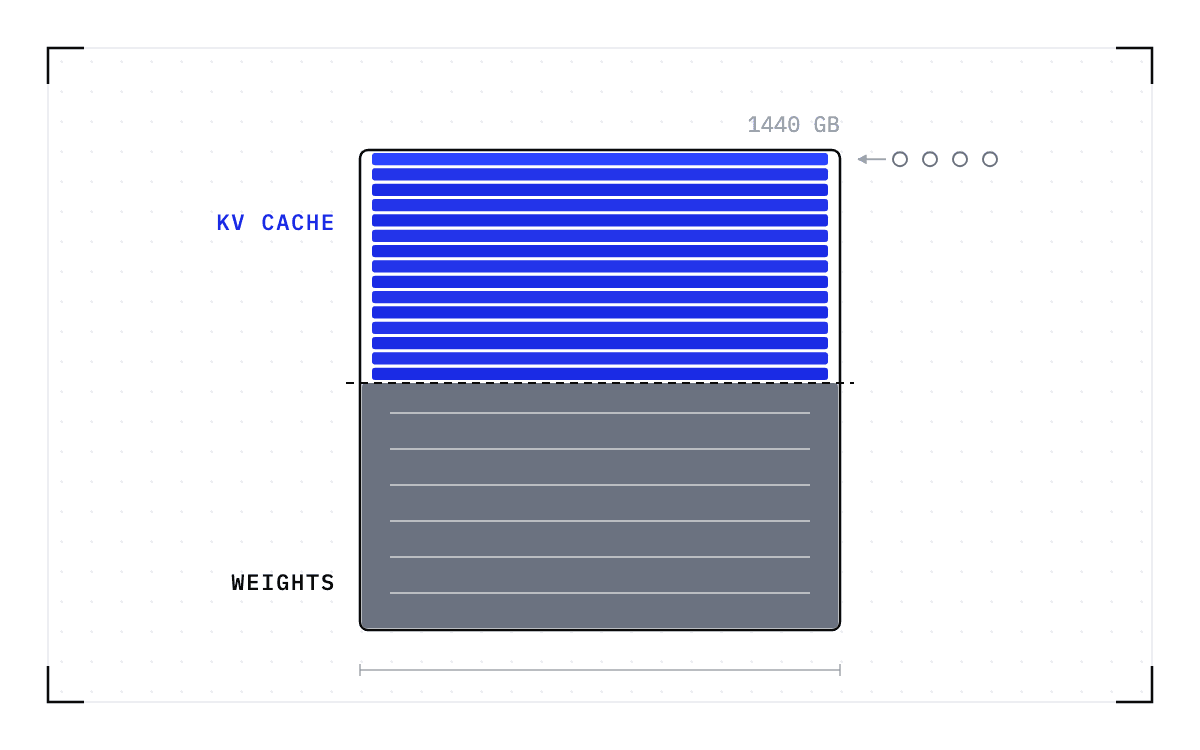
Cedana. Blueprint of a large square tank outlined in ink, its lower half filled dark grey with faint horizontal lines, a dashed line across its surface, and the upper half stacked with fifteen thin blue slabs, the topmost brighter, with a row of small circles queued at its right edge and an arrow pointing in.Your KV cache now rivals your weights

Your KV cache now rivals your weights

Calculate KV cache bytes from model configuration, precision and context length, then estimate how many live sessions fit after the weights are loaded.

read →
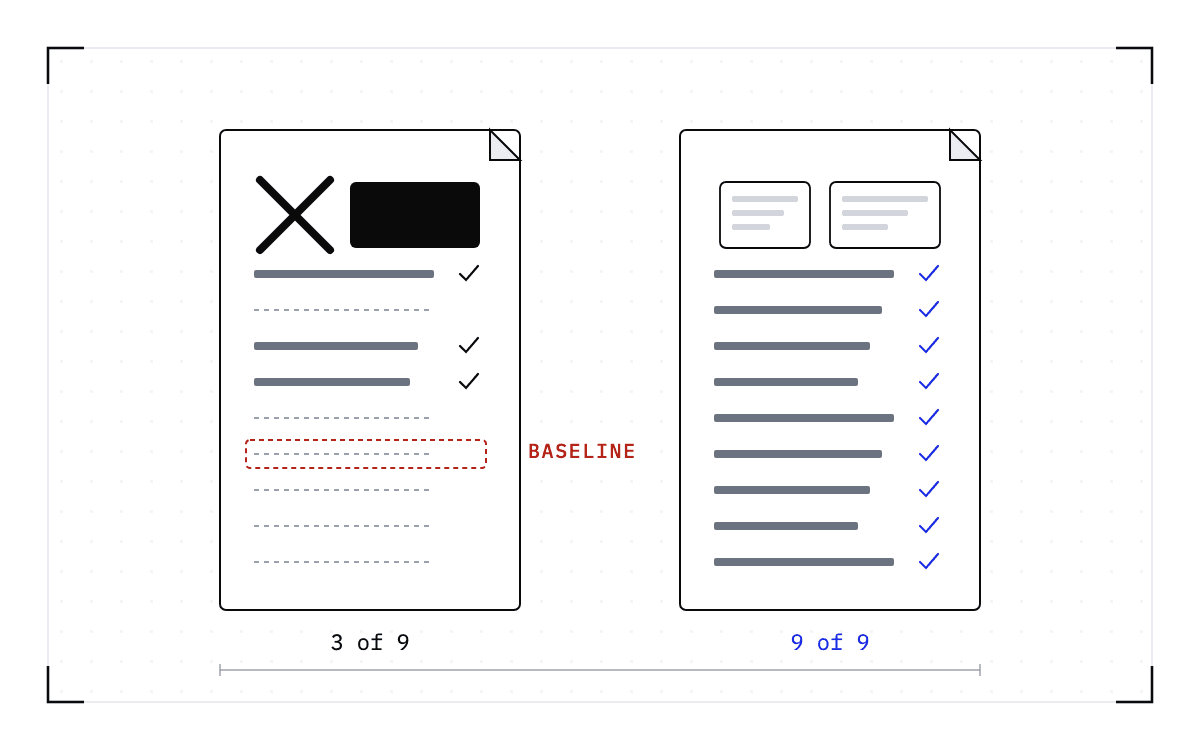
Cedana. Blueprint of two documents side by side. The left carries a large bold cross beside a solid black block at its top and nine lines beneath, three of them solid with ticks and six dashed, with the sixth ringed in dashed red. The right carries two small ruled boxes at its top and nine solid lines each with a blue tick.How to read a checkpoint benchmark

How to read a checkpoint benchmark

Evaluate checkpoint benchmarks using nine disclosures, from capture scope and clock boundaries to storage, repeated runs and performance after restoration.

read →
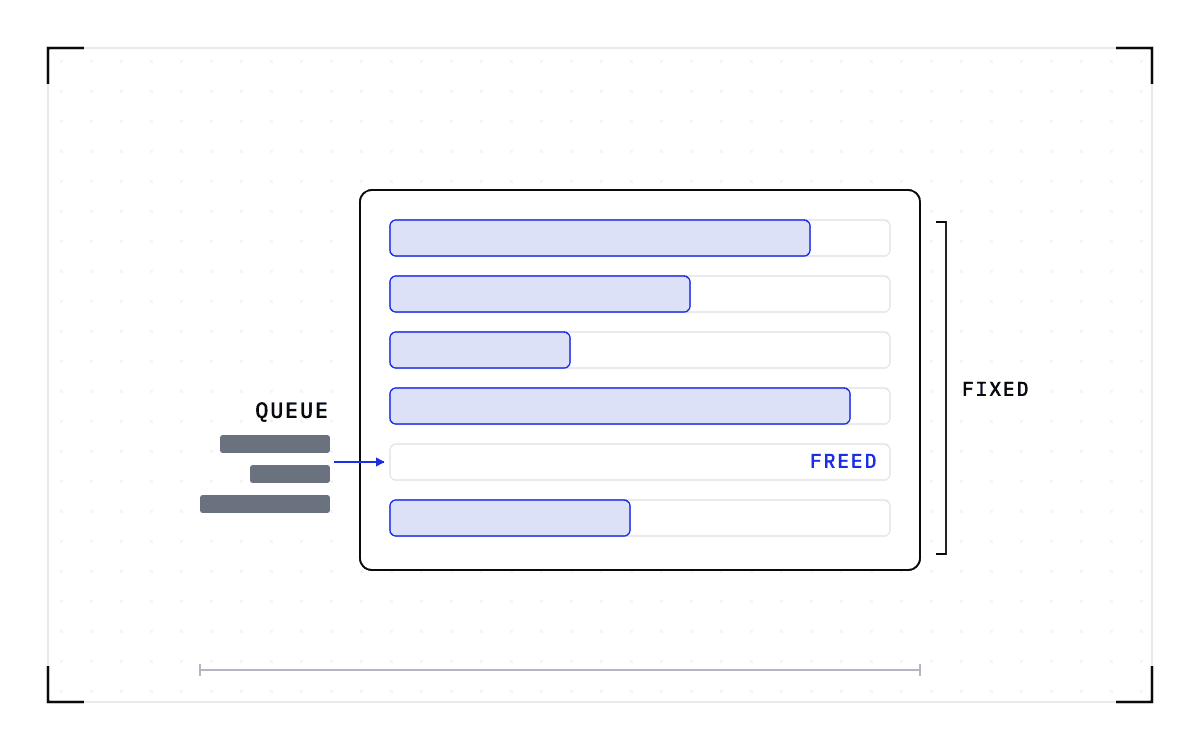
Cedana. Blueprint of a large outlined box holding six horizontal slots. Five slots are filled from the left with pale-blue bars of different lengths; the fifth slot is empty. Outside the box on the left, three short dark grey bars are stacked, and a blue arrow leads from the top one into the empty slot.The engine layer: batching, caching, and configuration as a commitment

The engine layer: batching, caching, and configuration as a commitment

Understand how continuous batching, paged KV memory and prefix caching affect serving performance, and why changing a worker's regime means launching a new one.

read →
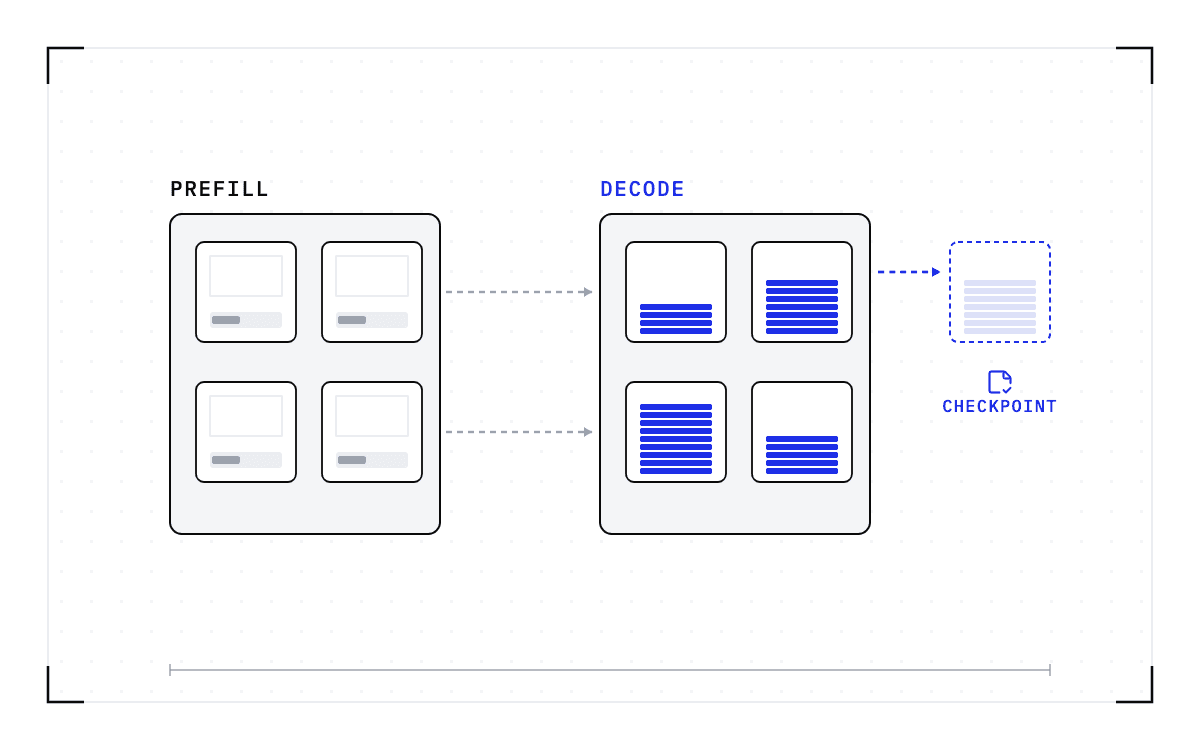
Cedana. Blueprint of two pools of four workers, marked prefill and decode. In the prefill pool each worker holds a short grey bar; grey dashed arrows cross to the decode pool, where each worker is stacked with blue slabs to a different height. From the tallest a blue dashed arrow leads right to a dashed outline holding the same slabs in pale blue, above a save icon marked checkpoint.Does disaggregated serving remove the need to move GPU workers?

Does disaggregated serving remove the need to move GPU workers?

See why separating prefill and decode does not make serving workers stateless, and what moving a worker means for its KV cache, sessions and startup cost.

read →
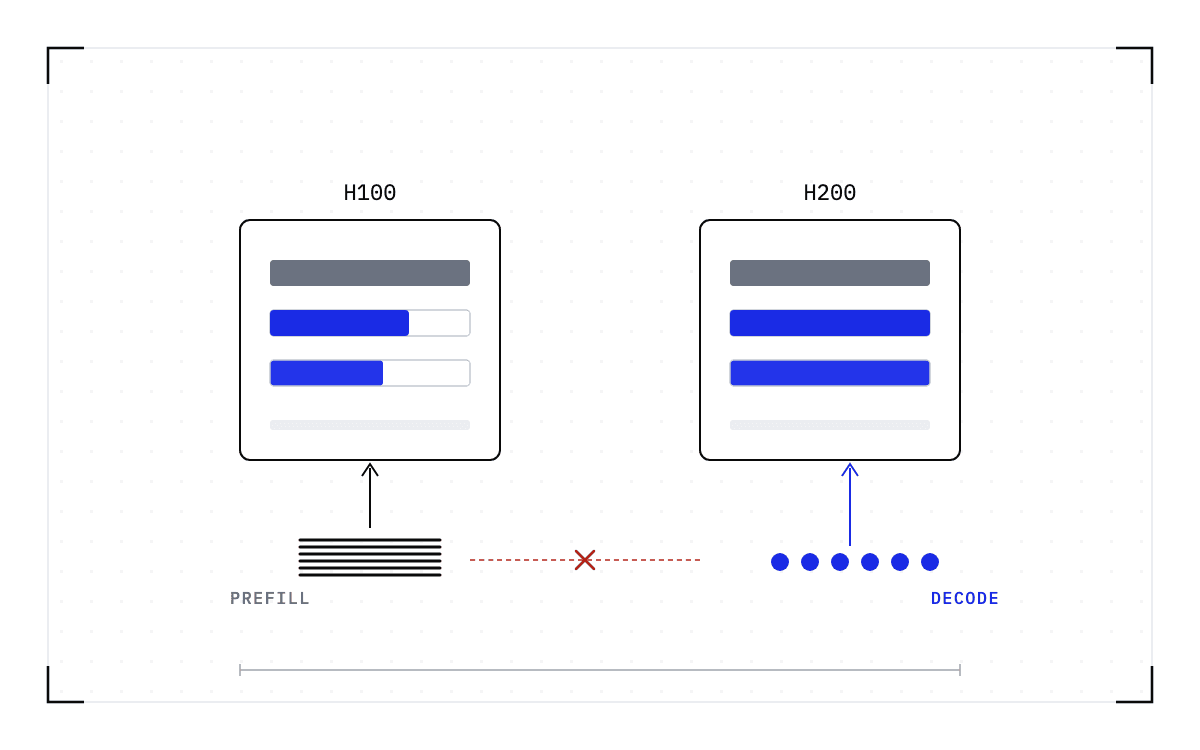
Cedana. Blueprint of two GPU cards side by side, each holding three horizontal bars: a dark bar of equal length in both, a blue bar noticeably shorter on the left card than on the right, and a second blue bar shorter still on the left. Below the left card a block of six parallel lines points up into it; below the right card a row of six blue dots points up into it; a red dashed line between the two is struck through.H100 for prefill, H200 for decode: the mismatch you pay for twice

H100 for prefill, H200 for decode: the mismatch you pay for twice

Compare H100 and H200 memory and compute for prefill and decode. Account for cache-transfer cost and why moving across GPU models still requires a cold start.

read →
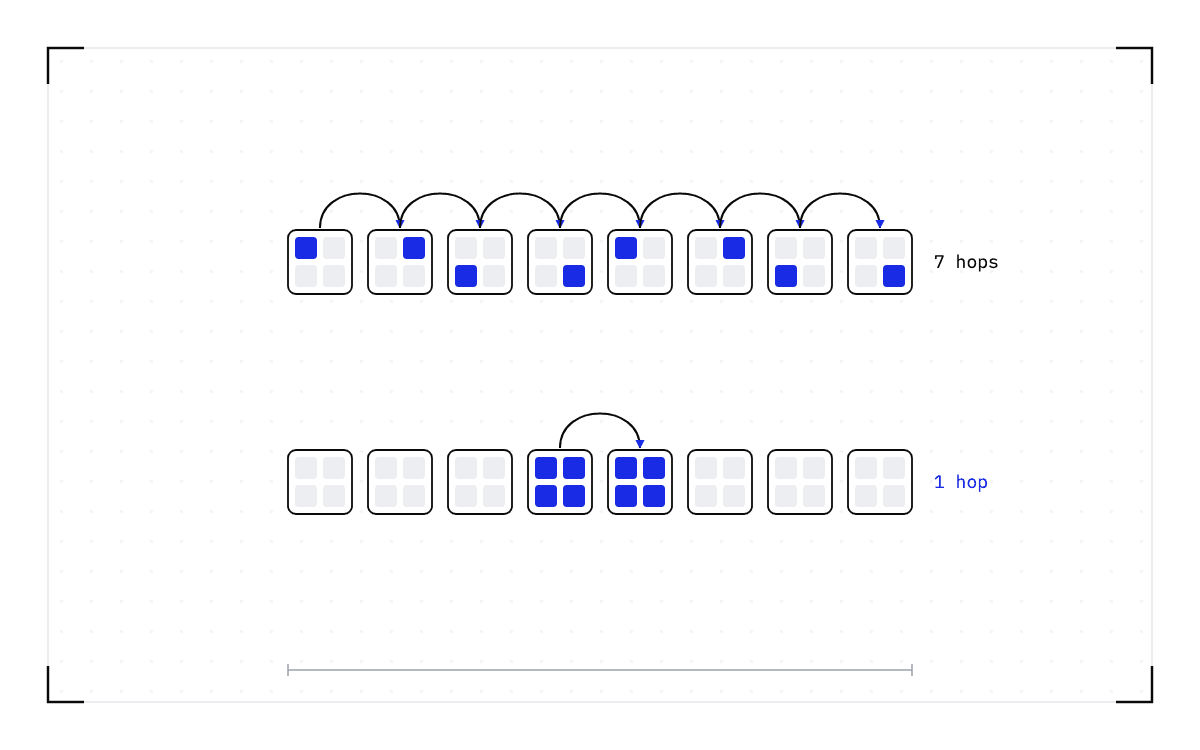
Cedana. Blueprint of two rows of eight outlined boxes, each box holding four small tiles. In the top row one tile per box is blue and seven small arcs hop from box to box across the whole row. In the bottom row all four tiles are blue in only the fourth and fifth boxes, joined by a single arc, and every other tile is pale grey.Expert placement in a mixture-of-experts deployment is a systems decision

Expert placement in a mixture-of-experts deployment is a systems decision

Separate a model router's expert choices from the deployment layout you control. Review expert placement, attention parallelism and communication overlap.

read →
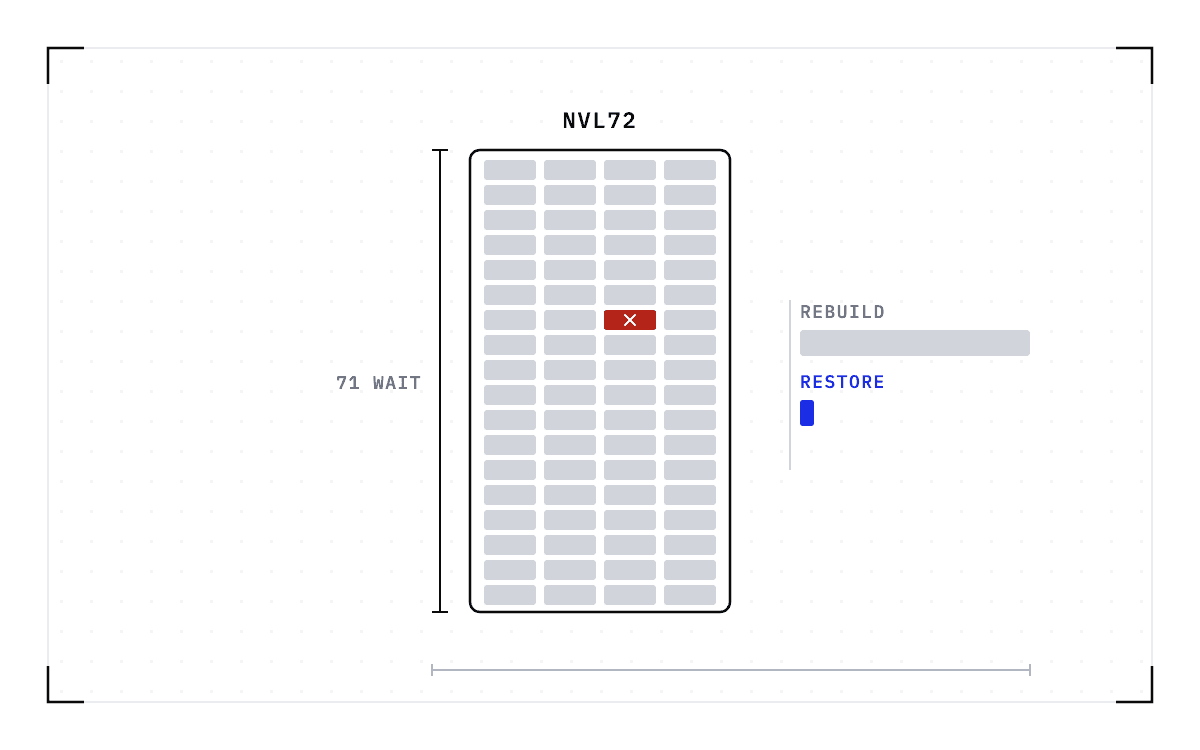
Cedana. Blueprint of a tall server rack holding eighteen trays of four grey GPU cells, with one cell in the upper middle filled red and struck out. A bracket down the rack's left side spans its full height. To the right, a long grey bar and beneath it a very short blue bar beside a saved-state icon.One GPU fails and 71 healthy GPUs wait

One GPU fails and 71 healthy GPUs wait

Understand how one failure stalls a tensor-parallel NVL72 workload, how recovery consumes healthy GPU-hours, and where published measurements stop.

read →
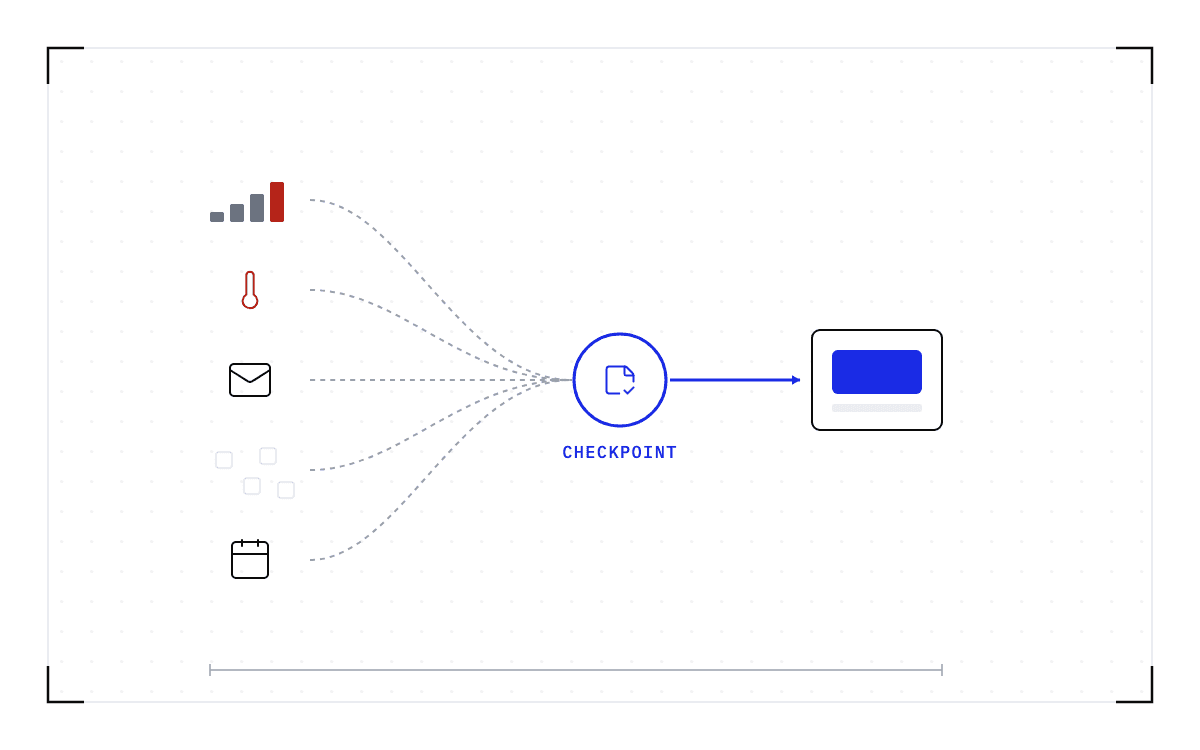
Cedana. Blueprint of five small glyphs down the left, a rising bar chart with a red top bar, a thermometer with a red column, an envelope, four scattered empty squares, and a calendar tile, each joined by a grey dashed wire to one blue ring at the centre holding a saved-state icon. From the ring one solid blue arrow leads to a node holding a blue block.Five fleet signals, five policies: from alert to automatic action

Five fleet signals, five policies: from alert to automatic action

Connect GPU health, thermal, reclaim, fragmentation and maintenance signals to workload-preserving actions. See which triggers ship and which remain designs.

read →
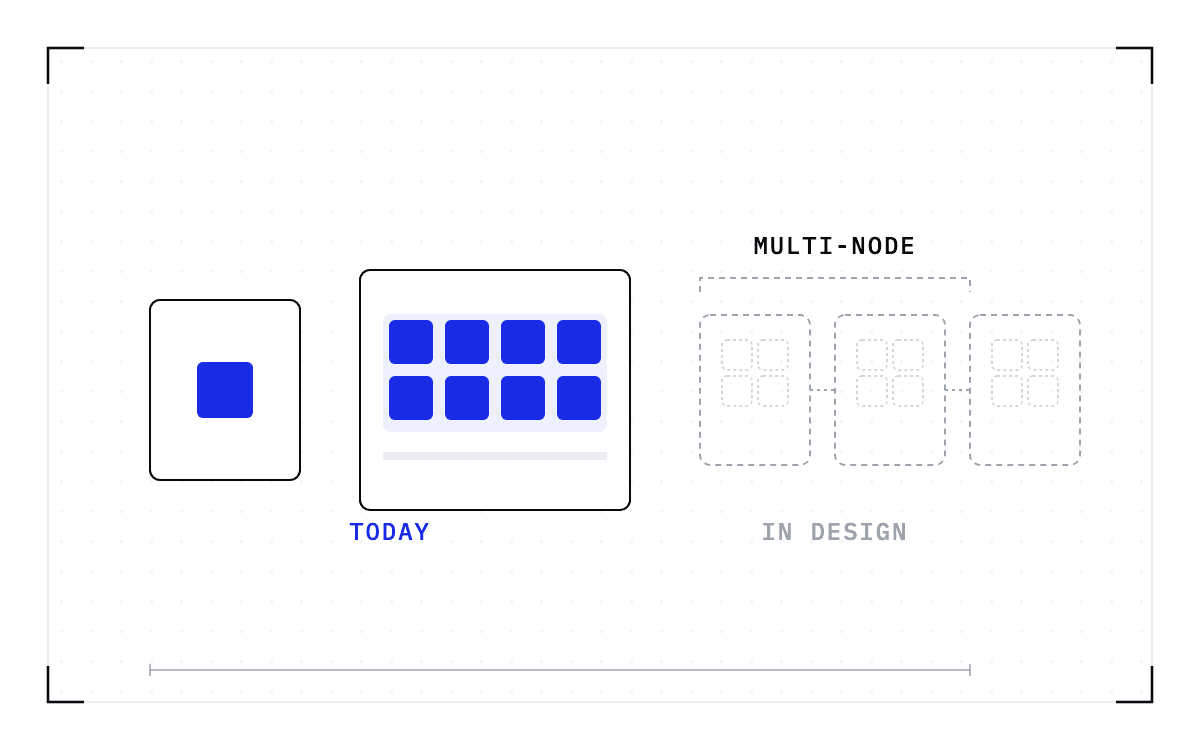
Cedana. Blueprint of three machines. A small one on the left holds one solid blue square. A wider one in the middle holds eight solid blue squares on a pale-blue tray. On the right three grey dashed machines each hold four dashed squares, linked by short dashed lines and spanned by one dashed bracket above them.Does multi-node checkpointing ship today?

Does multi-node checkpointing ship today?

Distinguish a workload moving between nodes from one spanning nodes. See Cedana's shipped single-node coverage and the multi-node tier still in design partnership.

read →
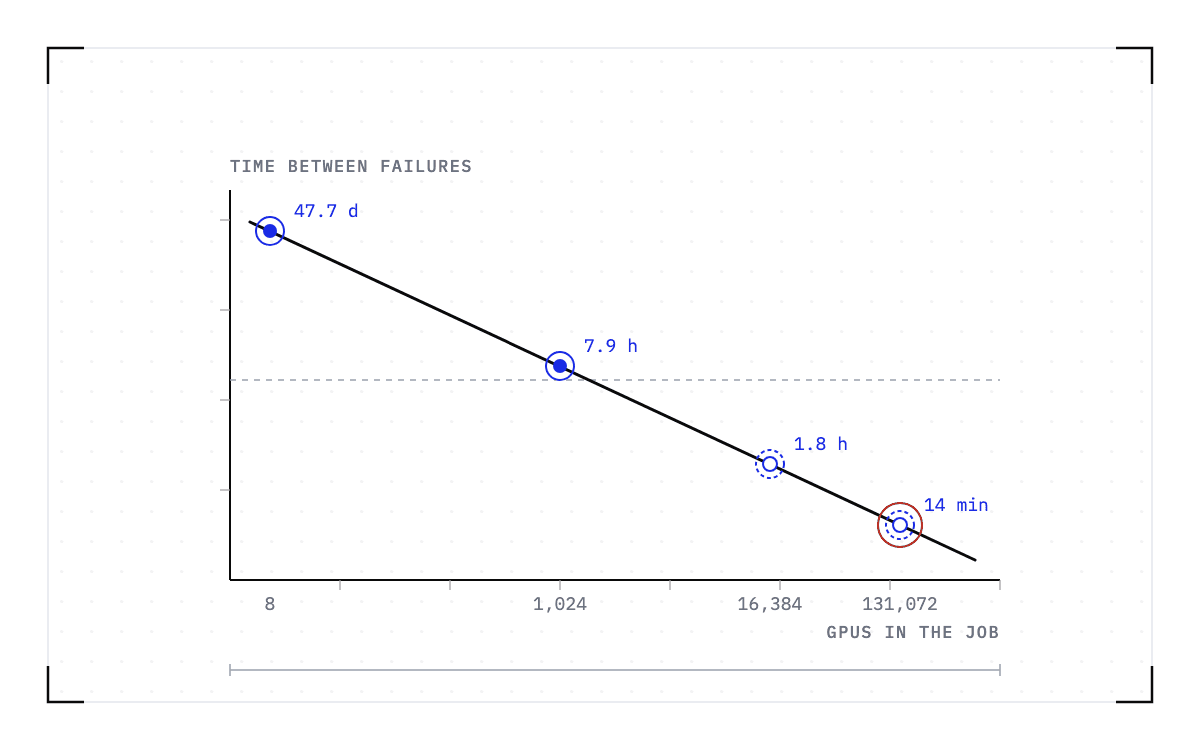
Cedana. Blueprint of a plot with a straight line falling from the upper left to the lower right across log axes. Two solid blue points sit on its upper half and two hollow dashed blue points on its lower half, the last one ringed in red near the bottom. A grey dashed horizontal line crosses the plot at the height of the second point.GPU failure frequency scales with the fleet, not the on-call rotation

GPU failure frequency scales with the fleet, not the on-call rotation

Use published cluster studies to understand how GPU job interruptions scale, distinguish measurements from projections, and estimate your own fleet's rate.

read →
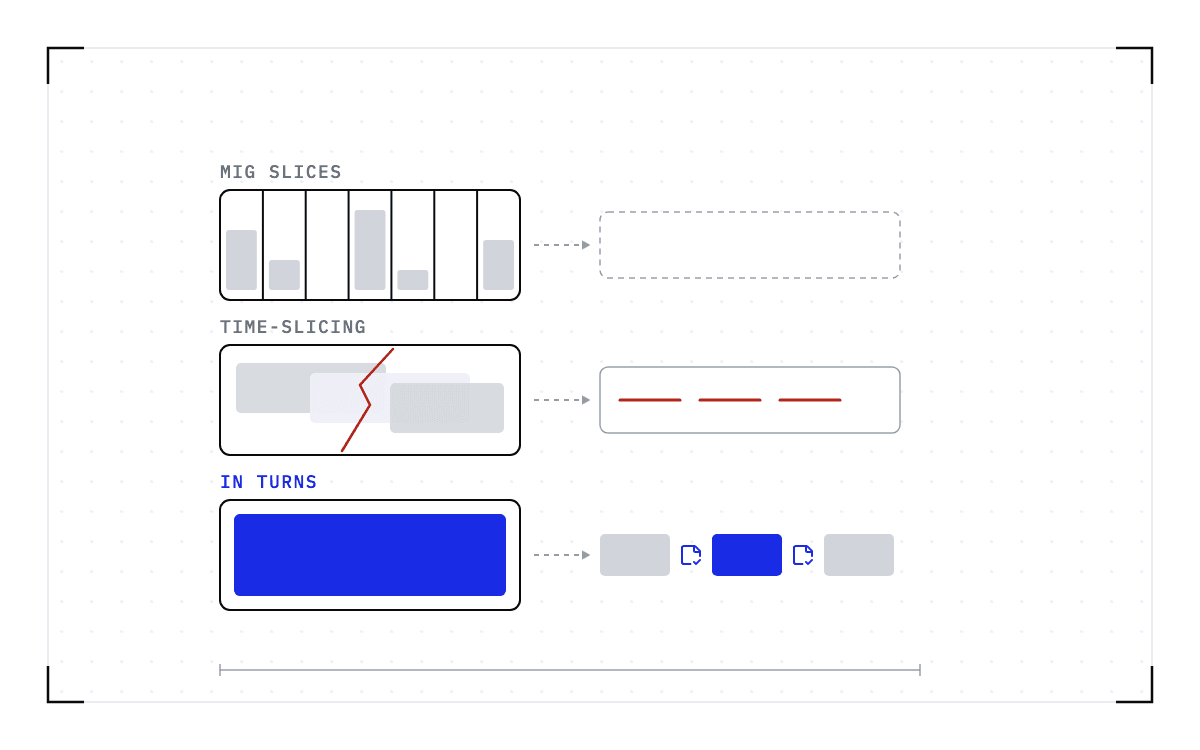
Cedana. Blueprint of the same GPU card drawn three times down the left. The first is cut by six vertical walls into seven slices holding grey blocks of different heights, with a dashed empty card to its right. The second holds three overlapping translucent blocks with a red crack running through them, and a box to its right of three red dashes. The third is filled by one solid blue block, with a row of three blocks to its right, grey, blue, grey, separated by saved-state icons.Sharing GPUs without fixed MIG slices

Sharing GPUs without fixed MIG slices

Compare MIG, time-slicing, MPS and serial sharing through checkpoints. Understand isolation, fixed slice sizes and the save-and-restore cost of switching jobs.

read →
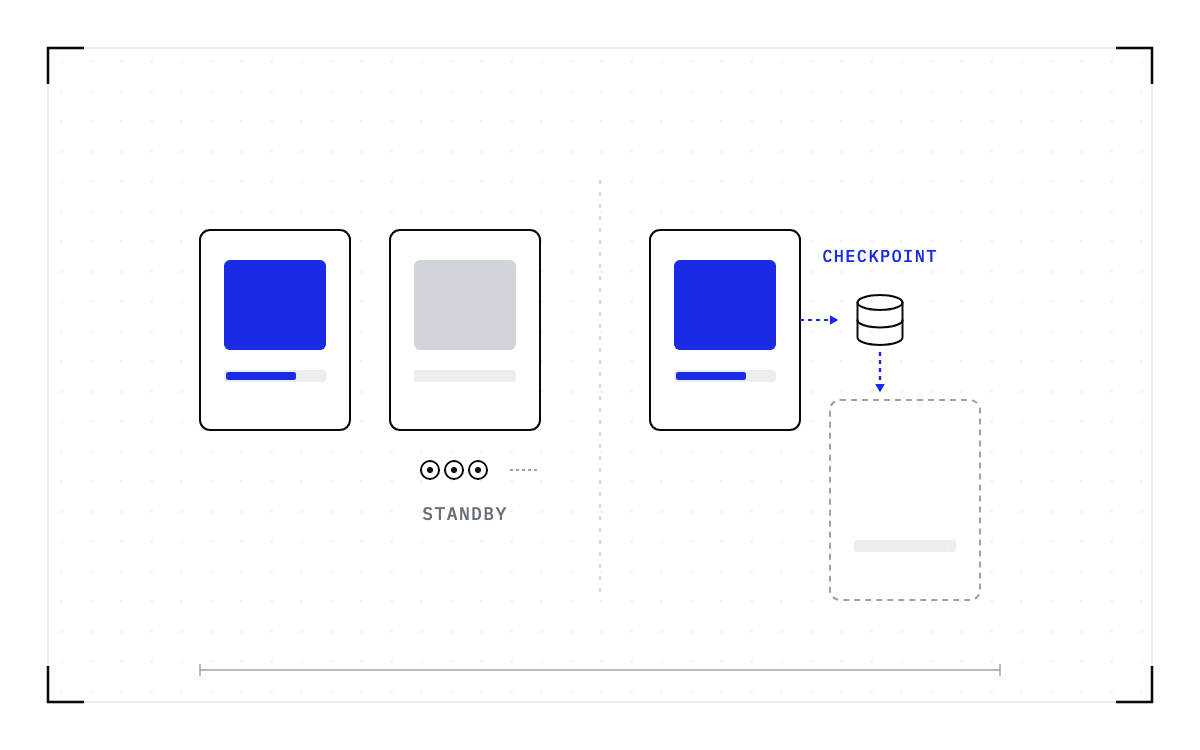
Cedana. Blueprint split by a faint dashed line. On the left two identical nodes stand side by side, one holding a blue block, the other a grey one, with three coins and a dotted line beneath the grey. On the right one node holds a blue block and points to a small storage cylinder with a saved-state icon, from which a blue arrow drops to a dashed empty node outline below.Hot standby versus checkpoint recovery on the same hardware

Hot standby versus checkpoint recovery on the same hardware

Compare a spare GPU node with checkpoint recovery by cost, outage tolerance and saved session state. Choose per service tier and include time to find capacity.

read →
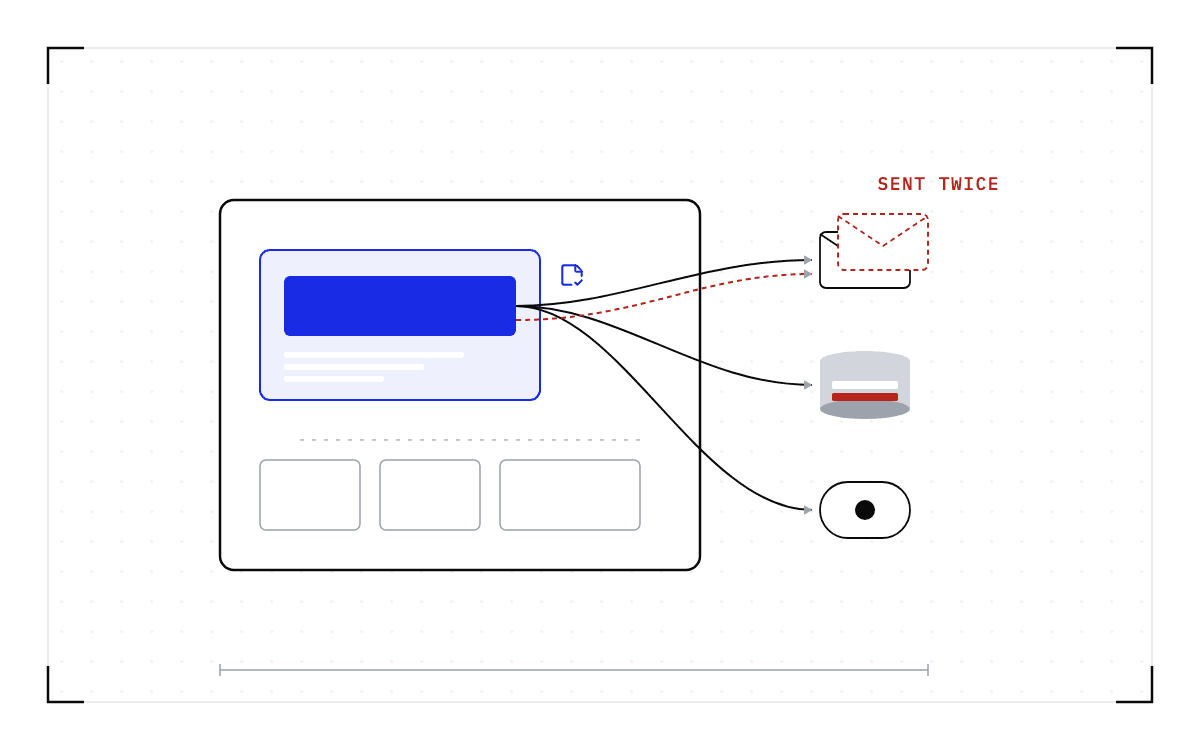
Cedana. Blueprint of a large rounded rectangle, the machine, holding a blue process block with a saved-state icon and three faint boxes beneath it. Three lines cross the machine's right edge to an envelope, a database cylinder and a round service pill outside. Behind the envelope a second envelope is drawn in dashed red, a second red line runs to it, and one row in the cylinder is red.What cannot be checkpointed in a GPU workload?

What cannot be checkpointed in a GPU workload?

Understand GPU checkpoint boundaries, unsupported resources, version constraints and external side effects your application must handle after a restore.

read →
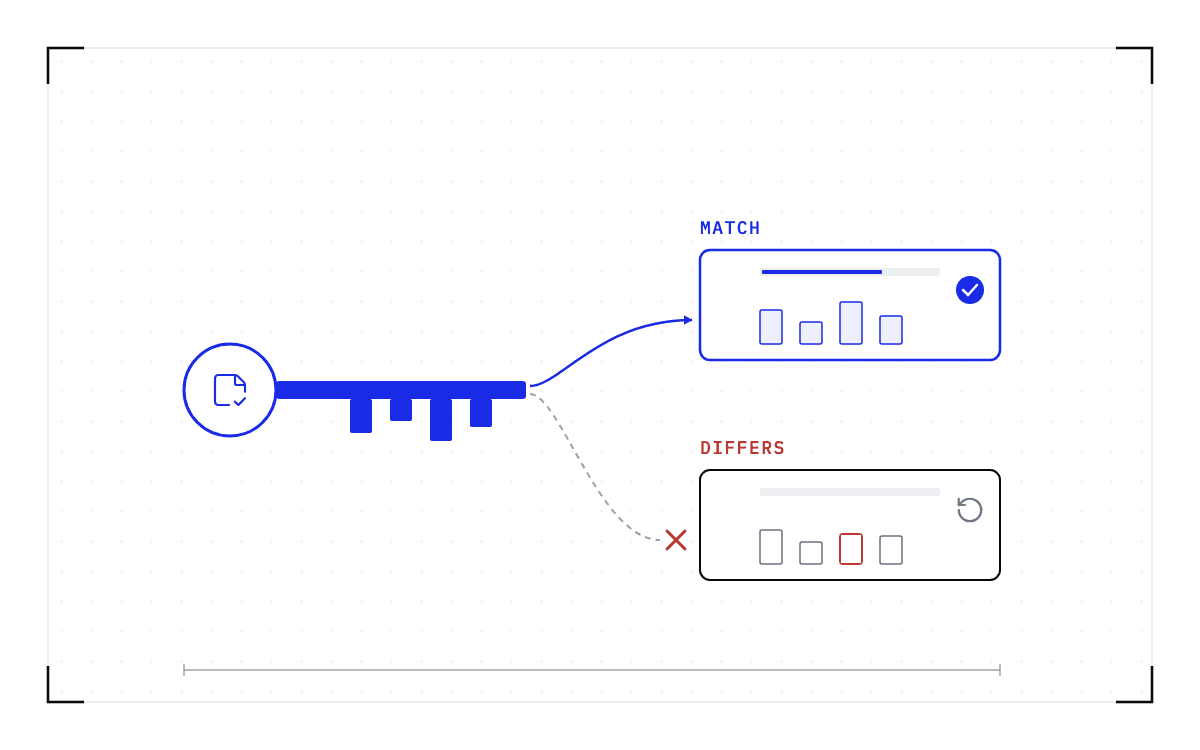
Cedana. Blueprint of a key drawn in blue, its bow a saved-state icon and its blade cut with four teeth of different heights. A blue line leads from it to a node box outlined in blue whose bottom edge is cut with four matching notches and a filled blue tick. A grey dashed line leads to a second node box below, outlined in ink, whose third notch is red and shallower; the line ends in a red cross, and a grey circular restart arrow sits inside the box.Driver, CUDA, and engine upgrades with workloads running, and the one limit

Driver, CUDA, and engine upgrades with workloads running, and the one limit

Plan rolling GPU driver, CUDA and engine upgrades around compatible capacity. Learn why existing checkpoints cannot carry a workload across a version change.

read →
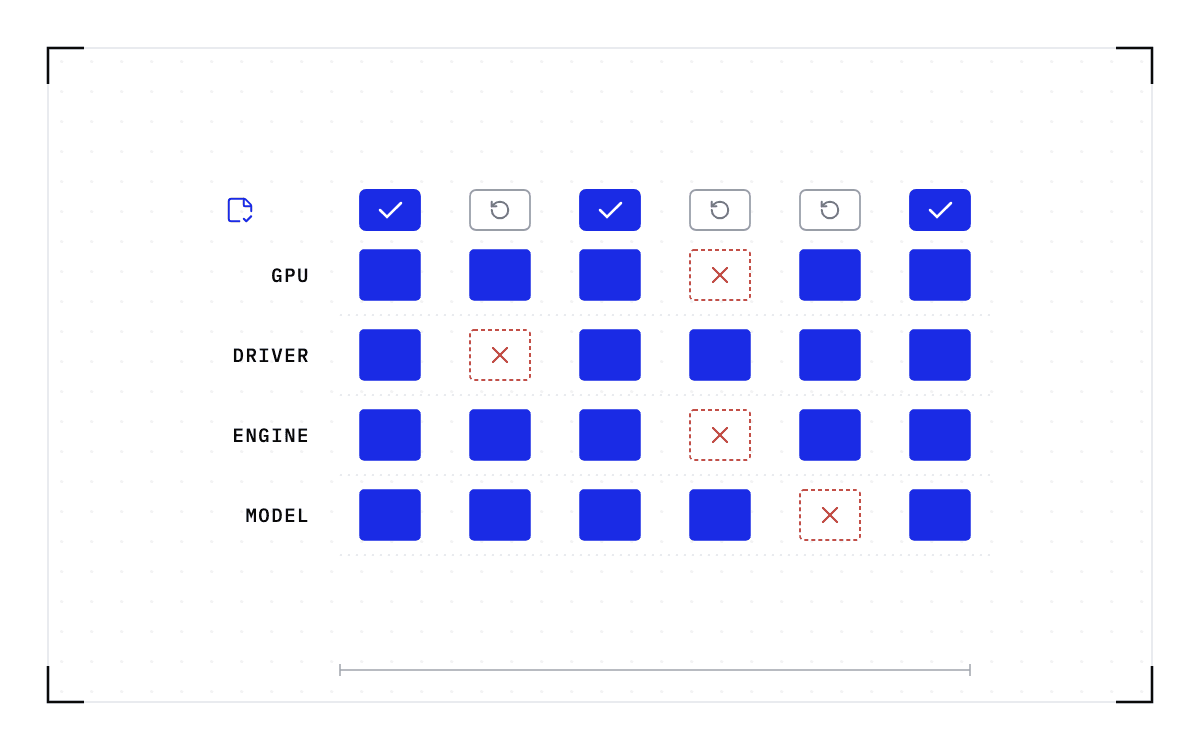
Cedana. Blueprint of a grid four rows deep and six columns wide, with a saved-state icon and four small glyphs down the left: a GPU card, a chip, a gear, a document. Most cells are solid blue; six are white with dashed red edges and a red cross. Three column headers are solid blue with a white tick; the other three are white with a grey circular arrow.Version mismatch and the compatibility matrix

Version mismatch and the compatibility matrix

Check the GPU, driver, engine and model versions a checkpoint records. Learn why a supported driver range does not mean checkpoints restore across versions.

read →
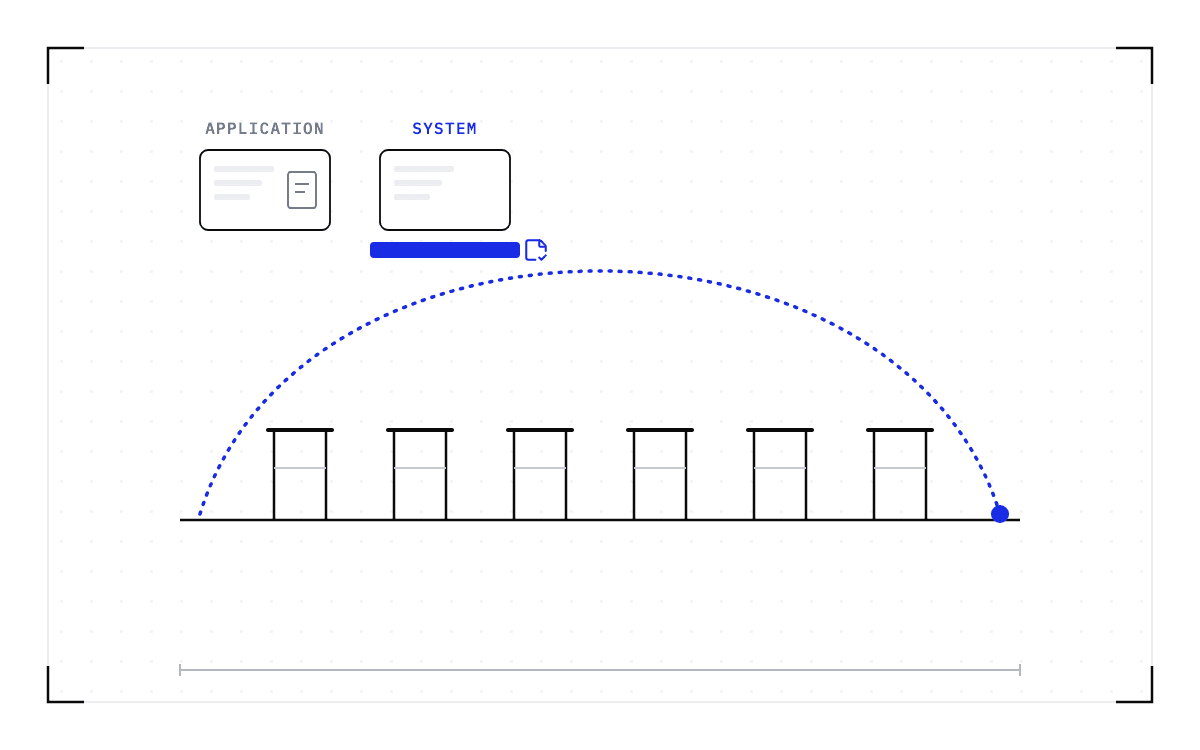
Cedana. Blueprint of a track with six hurdles in a row, each a pair of posts and a top bar, and one blue dotted arc clearing all six from end to end. Above the track at the left, two program boxes: one holding a small grey document inside it, the other standing on a solid blue band with a saved-state icon at its end.System-level vs application-level GPU checkpointing: the category and the bar

System-level vs application-level GPU checkpointing: the category and the bar

Compare application and system-level GPU checkpoints by saved state, code changes, overhead and six criteria for evaluating a checkpointing claim.

read →
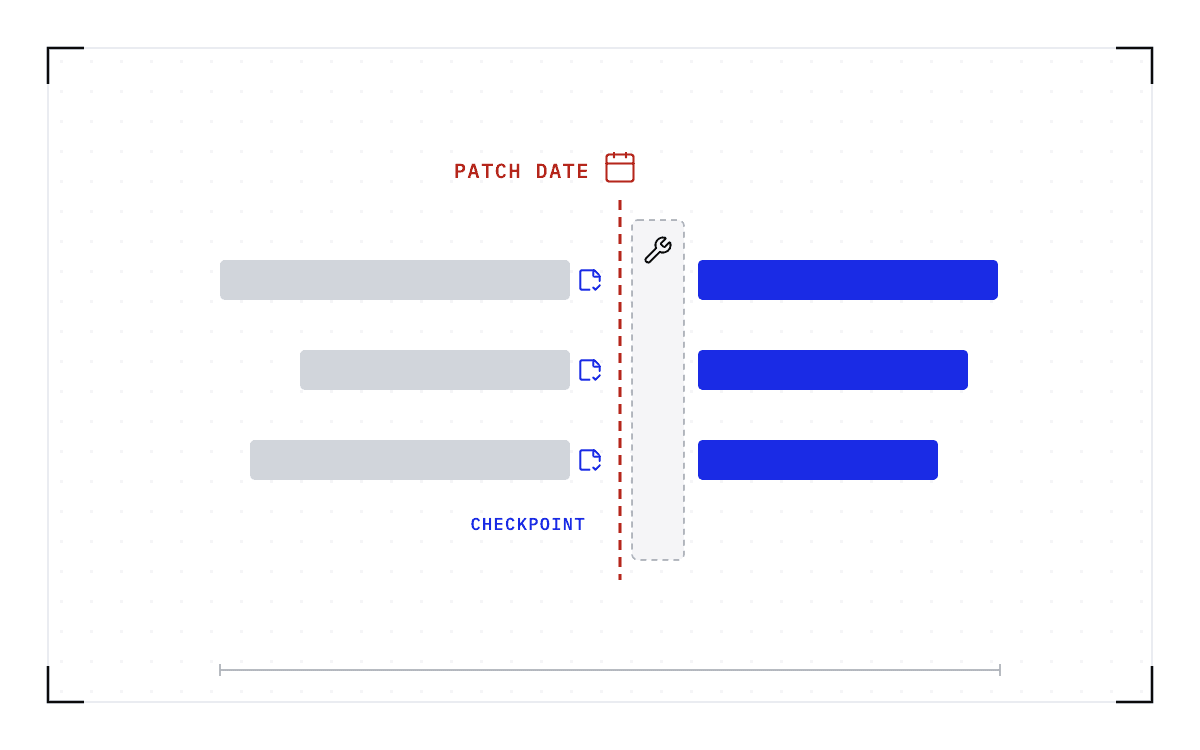
Cedana. Blueprint of three grey job bars at staggered heights all ending just short of a red dashed vertical line under a red calendar icon marked patch date, each with a blue save icon at its end marked checkpoint. A narrow dashed column with a wrench icon stands just past the line, and blue bars continue from the far side of it.Patch the GPU cluster on the security calendar, not the job calendar

Patch the GPU cluster on the security calendar, not the job calendar

Plan GPU security patches around the bulletin deadline. Move compatible workloads before maintenance and account for the last nodes crossing a driver upgrade.

read →
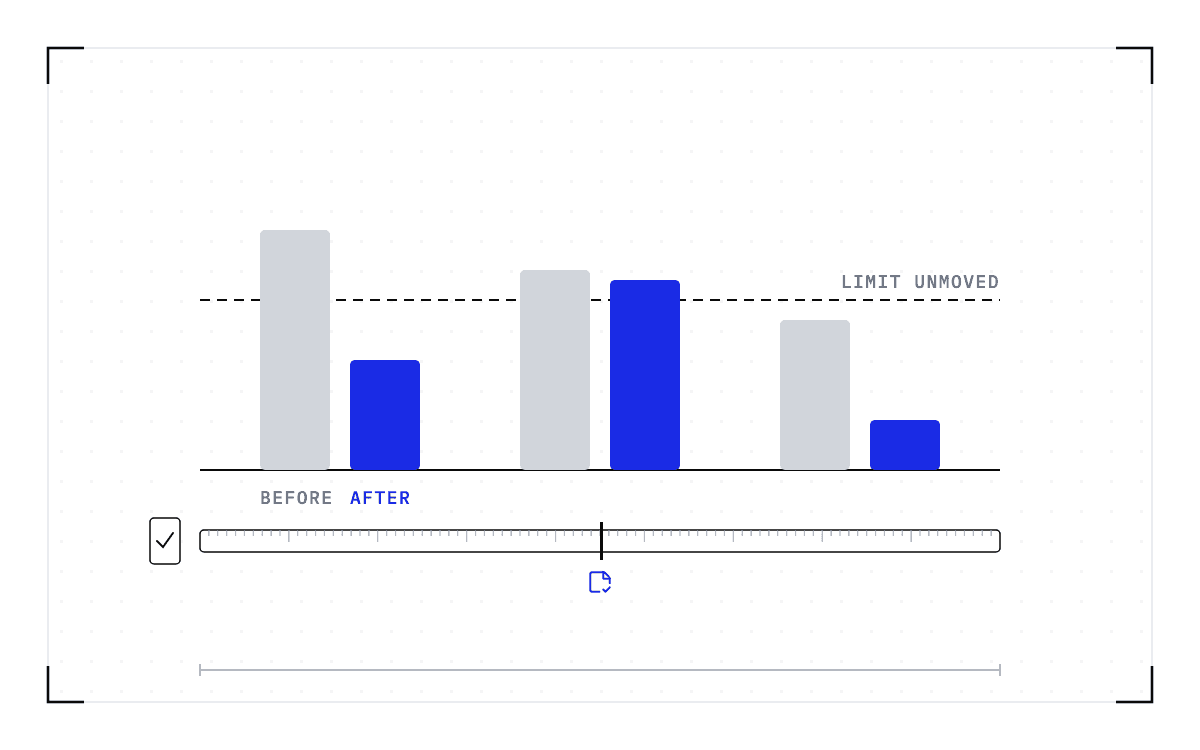
Cedana. Blueprint of three pairs of bars on one baseline, each pair a grey bar beside a blue one of different height, with one dashed horizontal line running unbroken across all three at the same height. Beneath, a ruled ninety-day strip with a black marker at its midpoint and a saved-state icon under it, and a small ticked box just before the strip begins.A 90-day wall-time PoC: what to measure before you change policy

A 90-day wall-time PoC: what to measure before you change policy

Design a Slurm checkpointing proof of concept using accounting history, application review and agreed thresholds for completion time, queue impact and exceptions.

read →
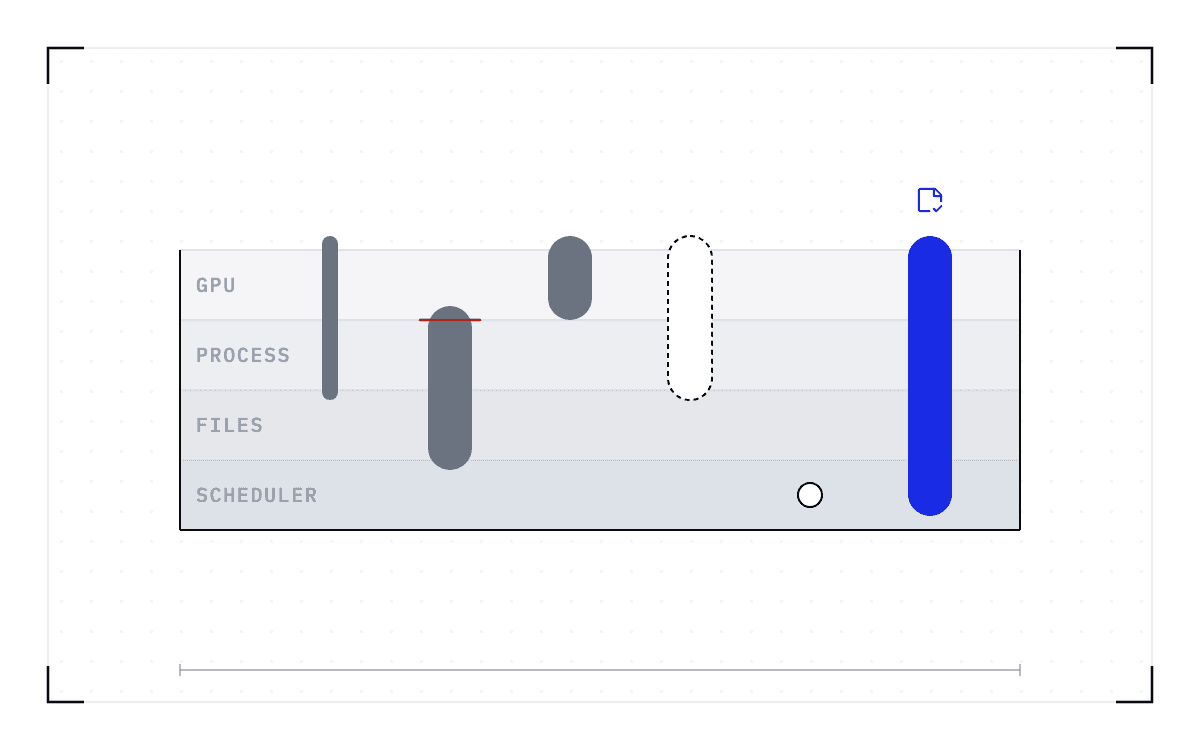
Cedana. Blueprint of four horizontal strata, the layers of state a running job holds, with six vertical core samples drilled into them: a thin one reaching partway, one stopping at a red bar on the top stratum, one taking only the top stratum, one drawn dashed, one that is only a small ring on the bottom stratum, and one solid blue core, marked with a saved-state icon, running through all four.Which checkpointing approach brings back the state your job is holding?

Which checkpointing approach brings back the state your job is holding?

Compare GPU checkpointing approaches by the state they save, their limits and the integration work needed to decide whether to build or buy.

read →
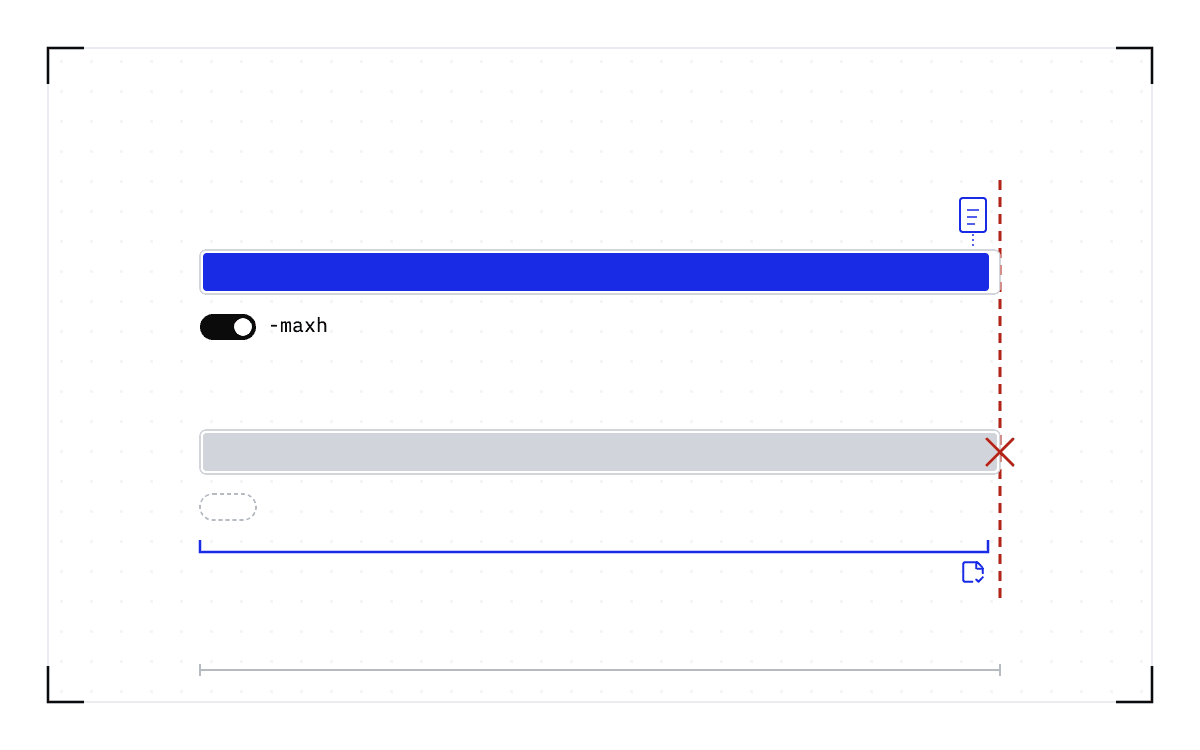
Cedana. Blueprint of two long bars running toward a red dashed wall on the right. The top bar is filled blue to just short of the wall, with a small blue document above its end and a black switch below it with the knob to the right. The bottom bar is filled grey all the way to the wall and ends in a red cross, with a dashed empty switch below it and, beneath that, a blue bracket spanning the bar with a saved-state icon near its end.GROMACS shows both the value and the limit of application checkpointing

GROMACS shows both the value and the limit of application checkpointing

Use GROMACS maxh, cpt and cpi to understand checkpointing across allocation limits, and see what other applications must build to offer the same recovery path.

read →
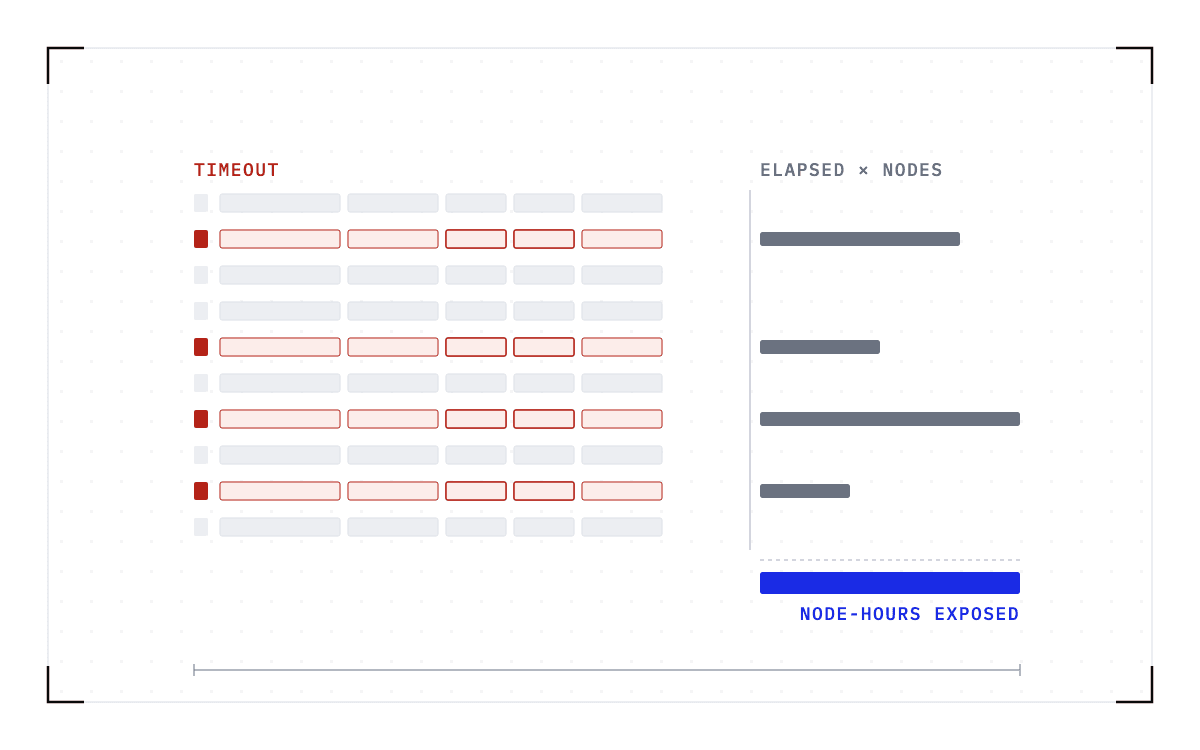
Cedana. Blueprint of ten ledger rows of small grey fields, four of them tagged red at the left with two of their fields outlined red. Beside each tagged row a dark grey bar of a different length extends to the right, and under the column of rows a single blue bar the width of the longest.Measuring the cost of wall-time termination from your sacct data

Measuring the cost of wall-time termination from your sacct data

Use sacct to count Slurm TIMEOUT records, calculate exposed node-hours and identify repeat jobs. Separate accounting evidence from proof that work was lost.

read →
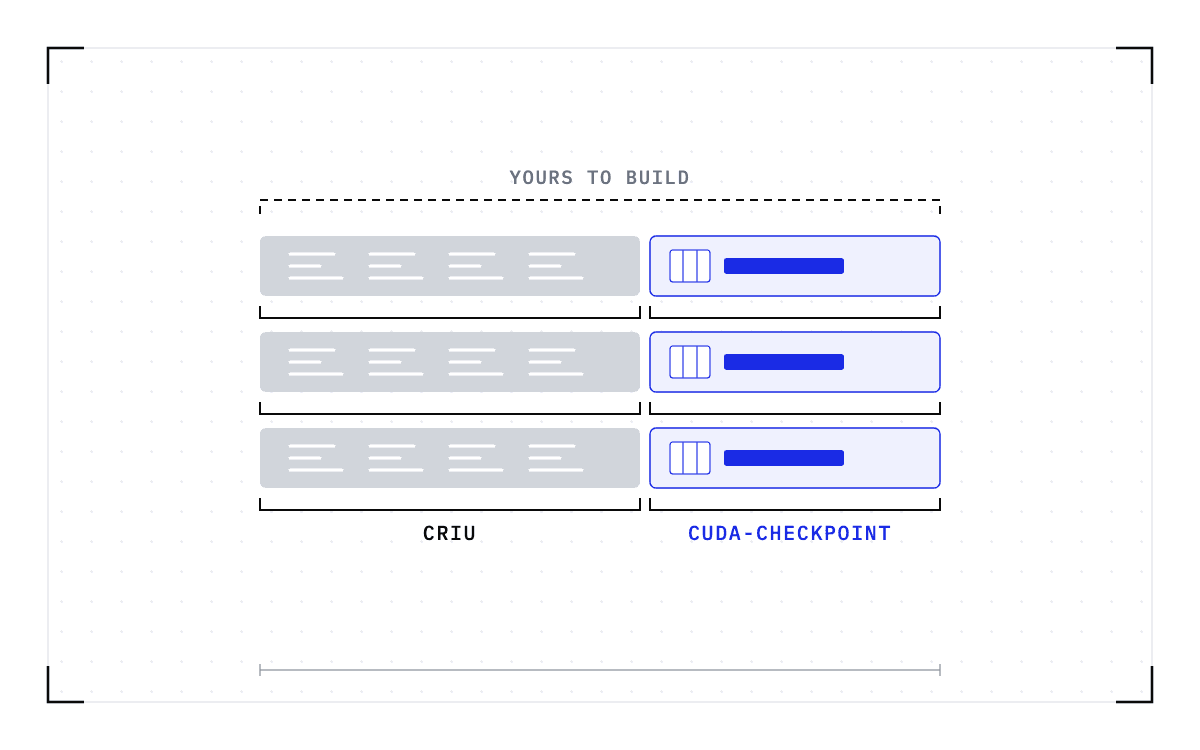
Cedana. Blueprint of three processes of one GPU job stacked as bars, each split into a grey CPU half and a blue-outlined GPU half. Under every bar a solid bracket spans the CPU half and another the GPU half, the two tools that cover them. Over all three bars a single dashed bracket, and one blue dashed line dropping through every GPU half at the same point, mark the layer nobody has built for you.What CRIU and cuda-checkpoint do when you wire them together yourself

What CRIU and cuda-checkpoint do when you wire them together yourself

See how CRIU and cuda-checkpoint save GPU workloads, where their support stops, and what your team must build around the open-source tools.

read →
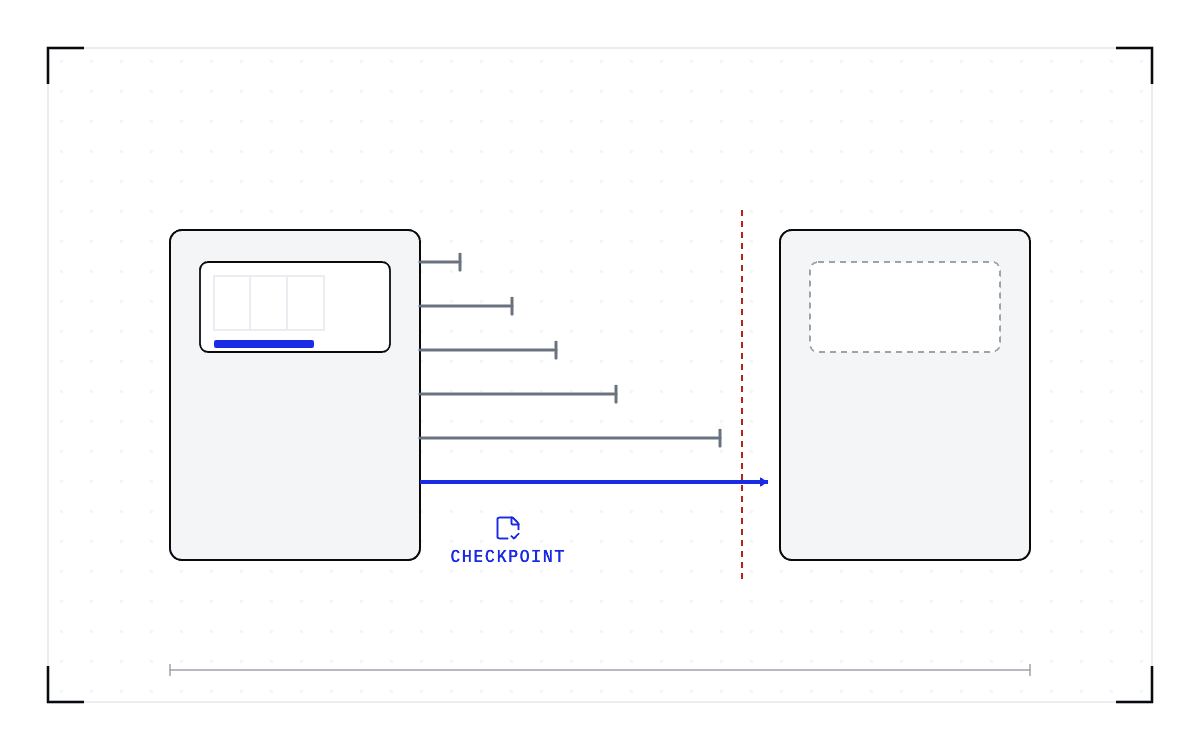
Cedana. Blueprint of two machines facing each other across a gap, a running GPU job in the left one and an empty dashed slot in the right. Five grey arrows leave the left machine and stop at increasing distances, each ending in a short tick, the longest at a red dashed line just before the right machine. One thick blue arrow, marked with a saved-state icon, crosses the whole gap and lands in the slot.Does Kubernetes, Docker, Slurm or Nextflow already restore a running job?

Does Kubernetes, Docker, Slurm or Nextflow already restore a running job?

Compare what Kubernetes, Docker, Podman, Slurm and Nextflow preserve, what they restart, and where restoring a running GPU job needs additional tooling.

read →
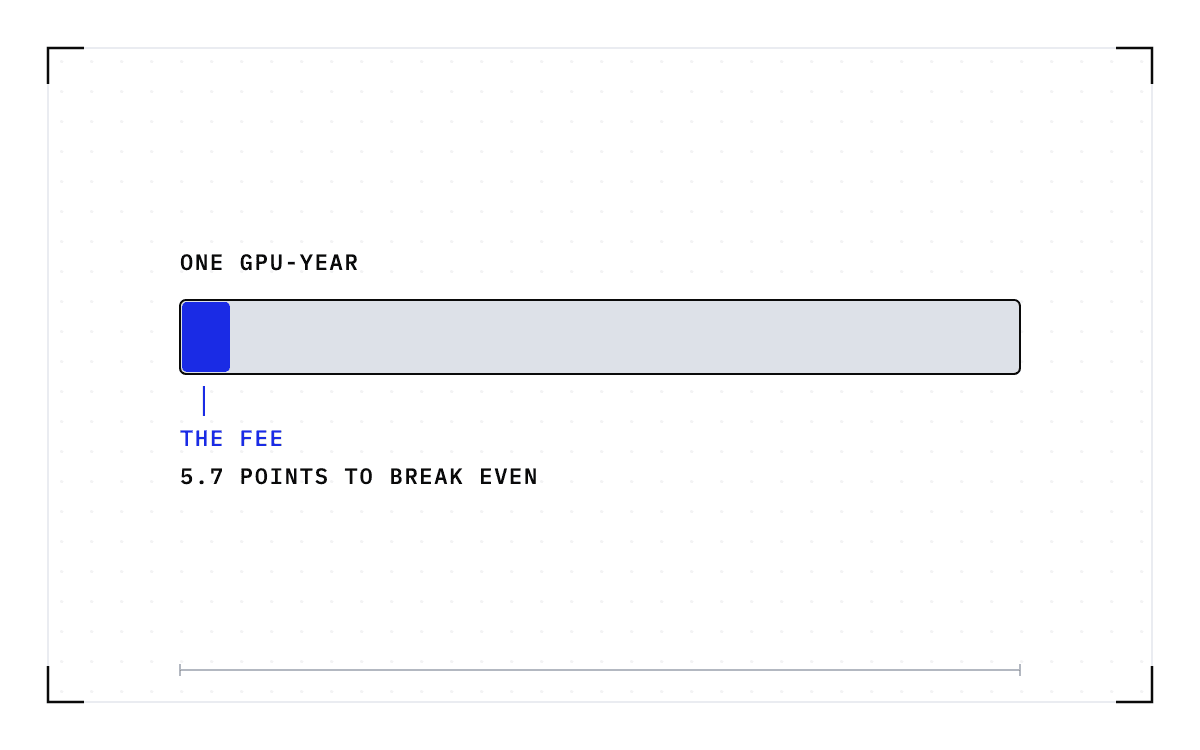
Cedana. Blueprint of one long grey bar marked one gpu-year with a thin blue slice at its left end. A leader drops from the slice to the words the fee, and beneath them five point seven points to break even.How much utilization improvement do you need to break even on GPU checkpointing?

How much utilization improvement do you need to break even on GPU checkpointing?

Calculate the utilization gain needed to cover a GPU checkpointing fee using your operating cost, paid hours, restore cost and recoverable work.

read →
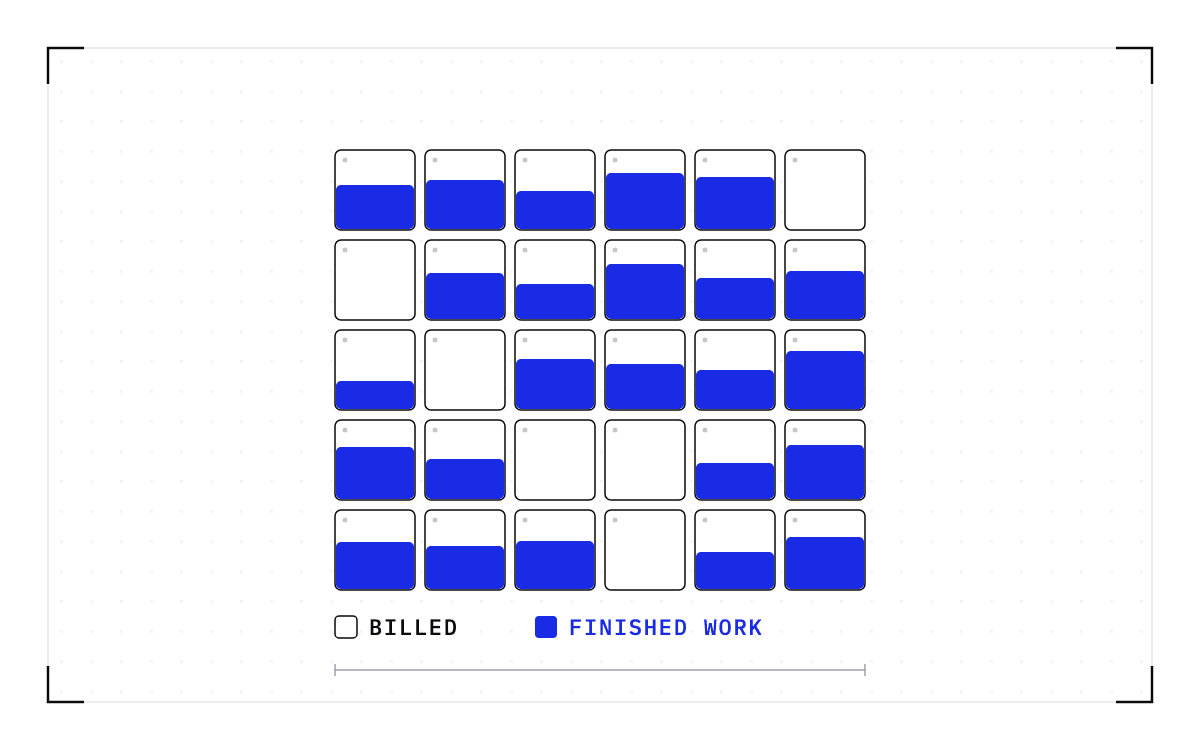
Cedana. Blueprint of a month as thirty outlined squares in a grid, each one a billed day; inside most of them a blue block rises to a different height, the share of that day's hours that produced finished work, and a few squares stand empty.Which utilization number goes into your own-versus-rent calculation?

Which utilization number goes into your own-versus-rent calculation?

Compare owning GPUs, renting nodes and paying per token using delivered GPU-hours, operating costs and utilization instead of demand forecasts alone.

read →
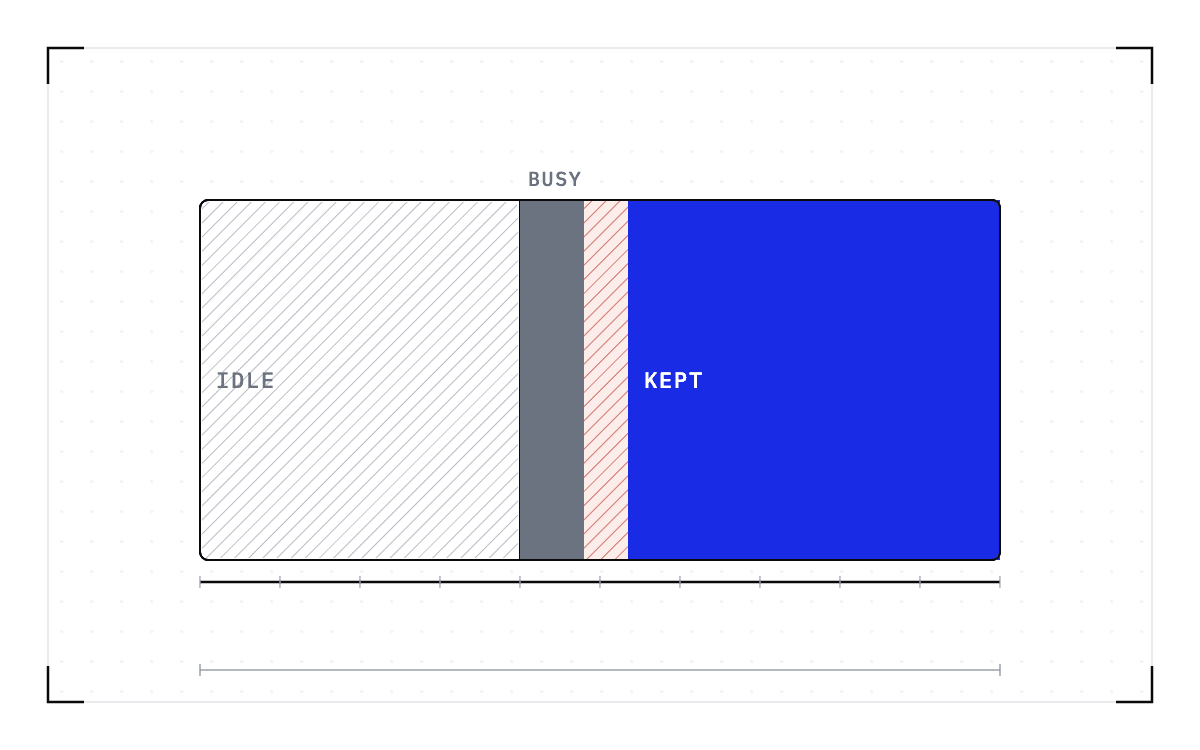
Cedana. Blueprint of one wide rectangle, a month's GPU bill: the left two fifths hatched grey for hours nothing ran on, the rest grey for hours the dashboard called busy, and inside that busy part a dark sliver and a red-hatched sliver at its left edge, hours spent loading and recomputing, before a solid blue block for the hours that produced work kept. A single ruled rate line runs under the whole width.How to put a dollar figure on the GPU-hours that produced nothing

How to put a dollar figure on the GPU-hours that produced nothing

Calculate the cost of idle GPUs, cold starts and recompute using your own hourly rate. Separate paid busy time from work your fleet actually keeps.

read →
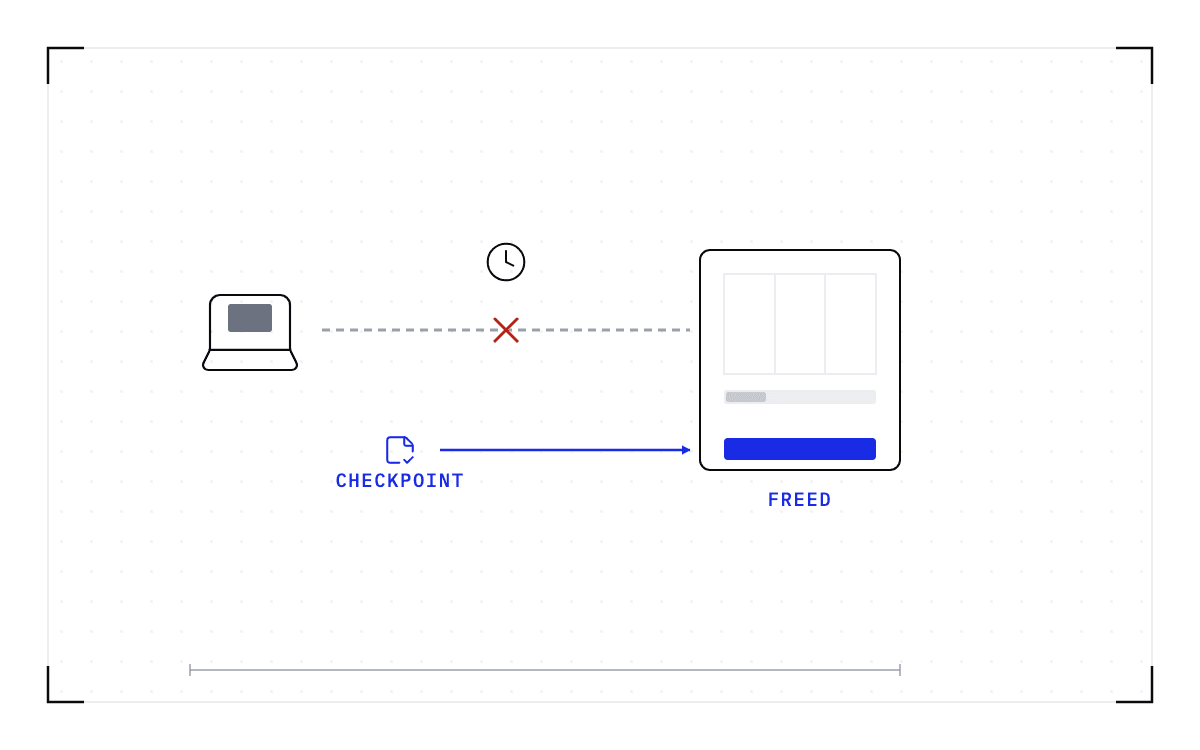
Cedana. Blueprint of a laptop on the left joined by a grey dashed cable to a GPU card on the right whose status bar is grey. A clock sits above the cable and a red cross cuts it. Below, a blue save icon marked checkpoint sends a blue arrow into the card, where a blue block now sits.Why an idle notebook keeps its GPU until you kill it

Why an idle notebook keeps its GPU until you kill it

See why idle notebooks and Ray actors keep their GPUs, how shutdown tools release them, and what a checkpoint must preserve before a session ends.

read →
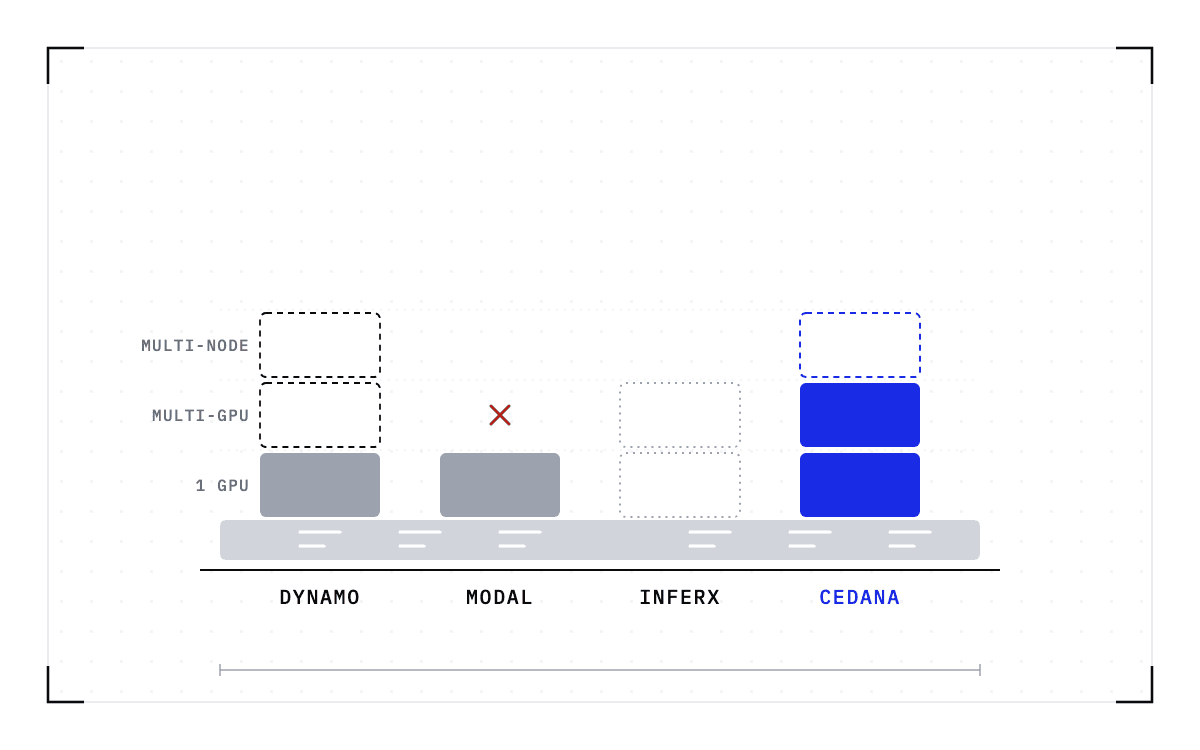
Cedana. Blueprint of four towers standing on one shared foundation, each tower up to three tiers tall. The first has one solid grey tier and two dashed above it; the second one solid tier with a small red cross where the next would be; the third two dotted outlines; the fourth two solid blue tiers and a dashed blue one on top.What NVIDIA Dynamo Snapshot and Modal GPU memory snapshots restore today

What NVIDIA Dynamo Snapshot and Modal GPU memory snapshots restore today

Compare Dynamo Snapshot, Modal, InferX and Cedana by captured state, restore compatibility, supported workloads and the limits behind their benchmarks.

read →
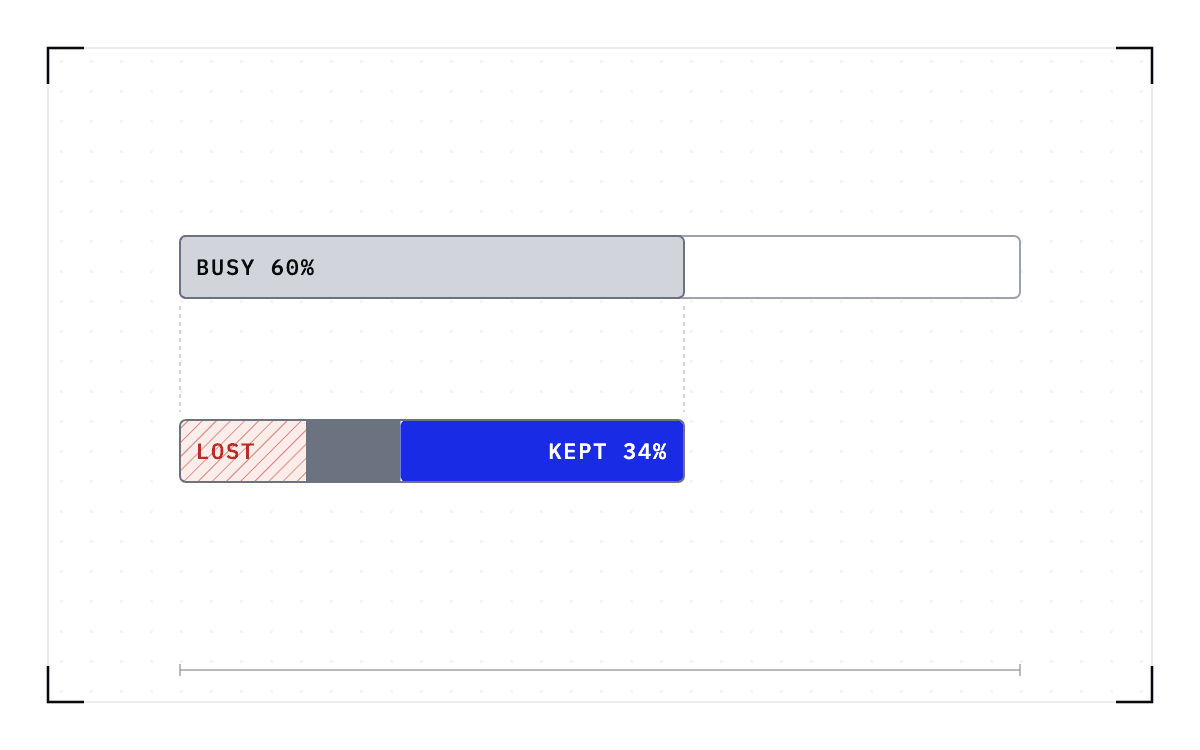
Cedana. Blueprint of two bars. The top bar is filled six tenths in grey, marked busy sixty percent. Two dashed guides drop from that grey portion to a second bar of the same width, split into a red hatched part marked lost, a dark part, and a blue part marked kept thirty-four percent.How much of your GPU utilization was work you kept?

How much of your GPU utilization was work you kept?

Distinguish GPU activity, MFU and useful output. Use job accounting and startup timings to estimate how much paid GPU time produced work you kept.

read →
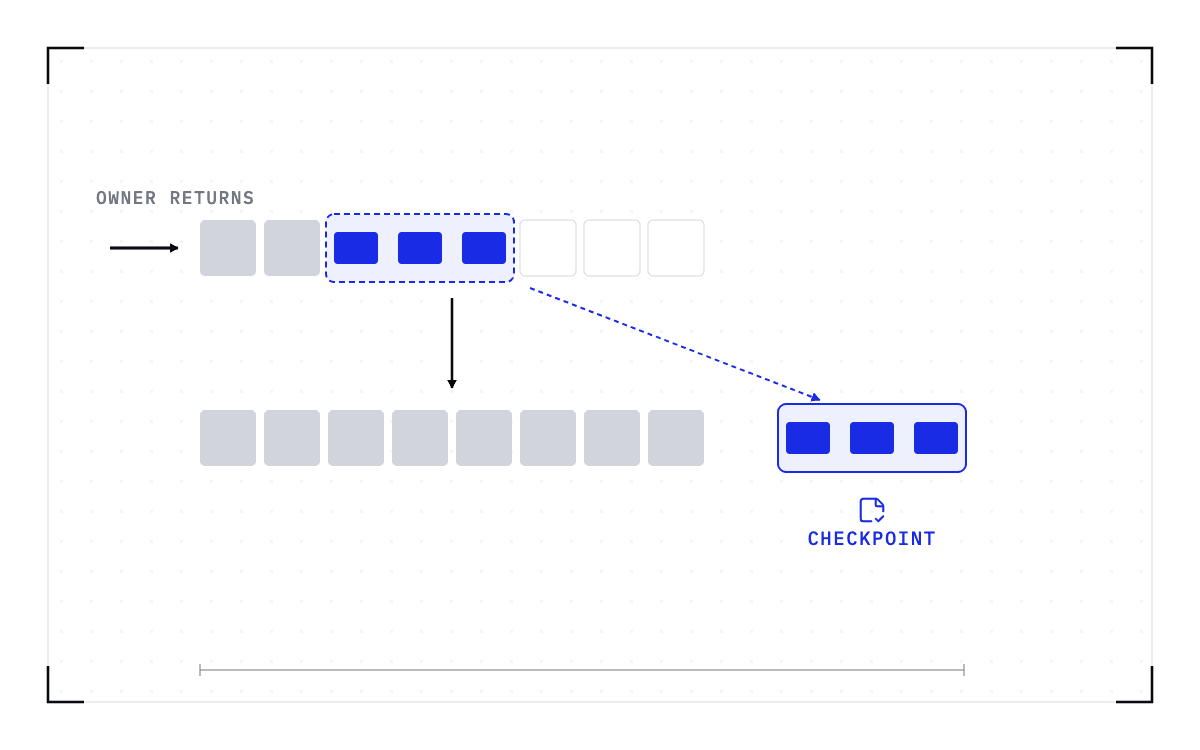
Cedana. Blueprint of two rows of eight GPU cells. In the top row two cells are grey and a blue job outlined in dashes sits across three of the empty ones, with an arrow arriving from the left marked owner returns. An arrow leads down to the second row, where all eight cells are grey, and the same blue job stands whole to the right above a save icon marked checkpoint.How to fill idle GPUs without killing the job that fills them

How to fill idle GPUs without killing the job that fills them

Compare how GPU schedulers lend and reclaim idle capacity, what preemption costs borrowers, and where checkpointing can preserve their work.

read →
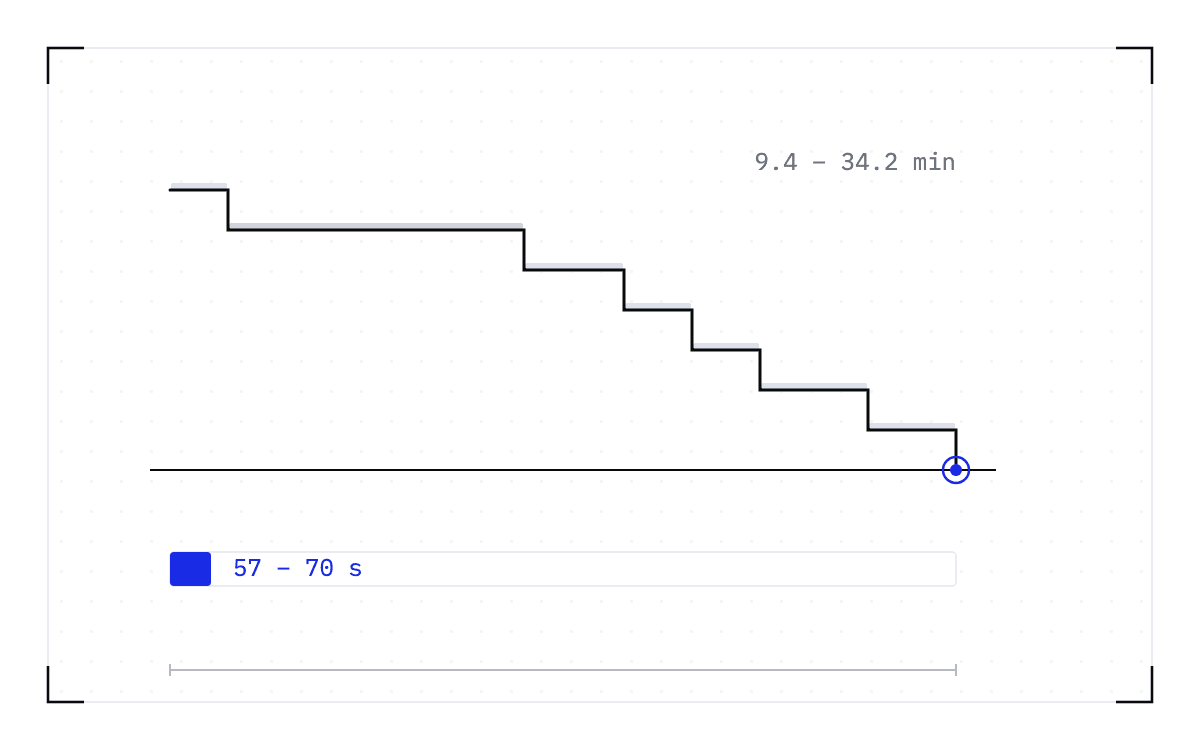
Cedana. Blueprint of an LLM worker's cold start as a staircase descending in seven treads to a ready floor, the second tread far longer than the rest, marked nine to thirty-four minutes. One lane below on the same span, a short blue bar marked fifty-seven to seventy seconds.Where the minutes go when an LLM worker cold starts

Where the minutes go when an LLM worker cold starts

Trace LLM cold starts through weight loading, compilation and warmup. Compare caching fixes with checkpoint restore and understand the storage limits.

read →
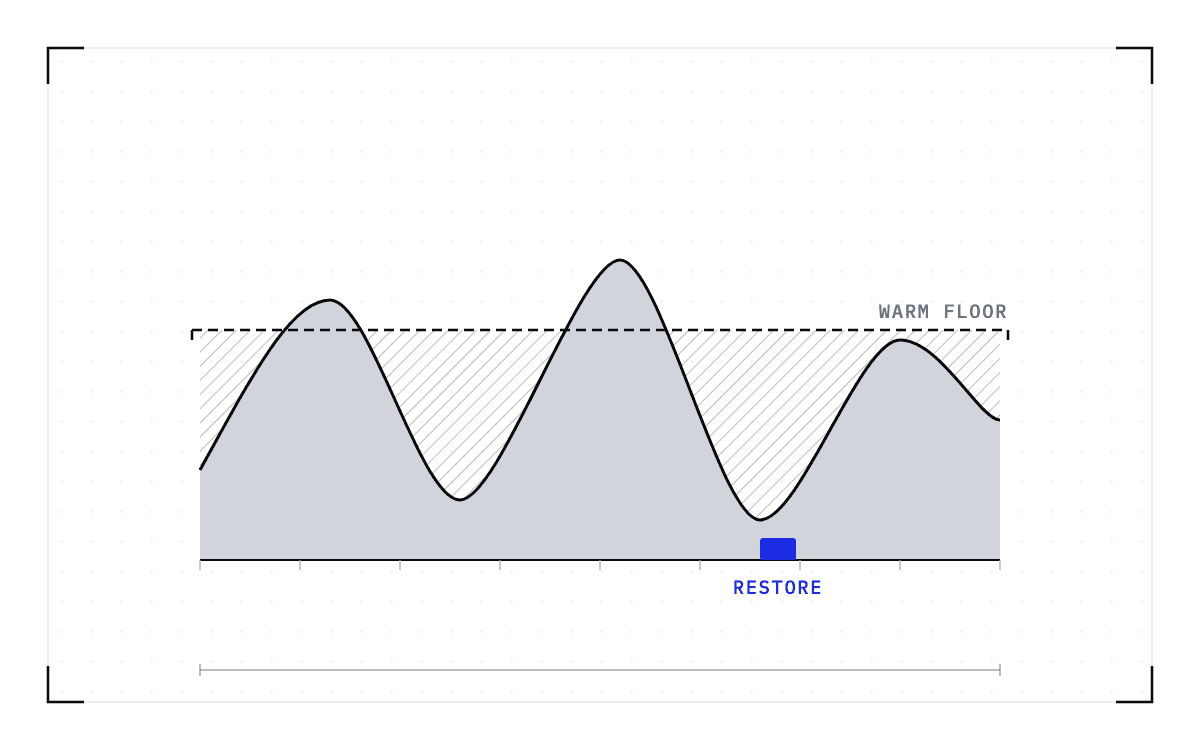
Cedana. Blueprint of a demand curve rising and falling above a baseline, with a thick dashed floor line drawn high across it; the area between the curve's troughs and the floor is hatched, capacity paid for and idle, while the peaks rise above the line. At one trough a small blue block sits on the baseline under a saved-state icon, the width of a restore.Can LLM inference scale to zero without paying for warm replicas?

Can LLM inference scale to zero without paying for warm replicas?

Understand when LLM inference can scale to zero, what warm replicas cost, and how restore time and request latency determine the capacity you keep ready.

read →
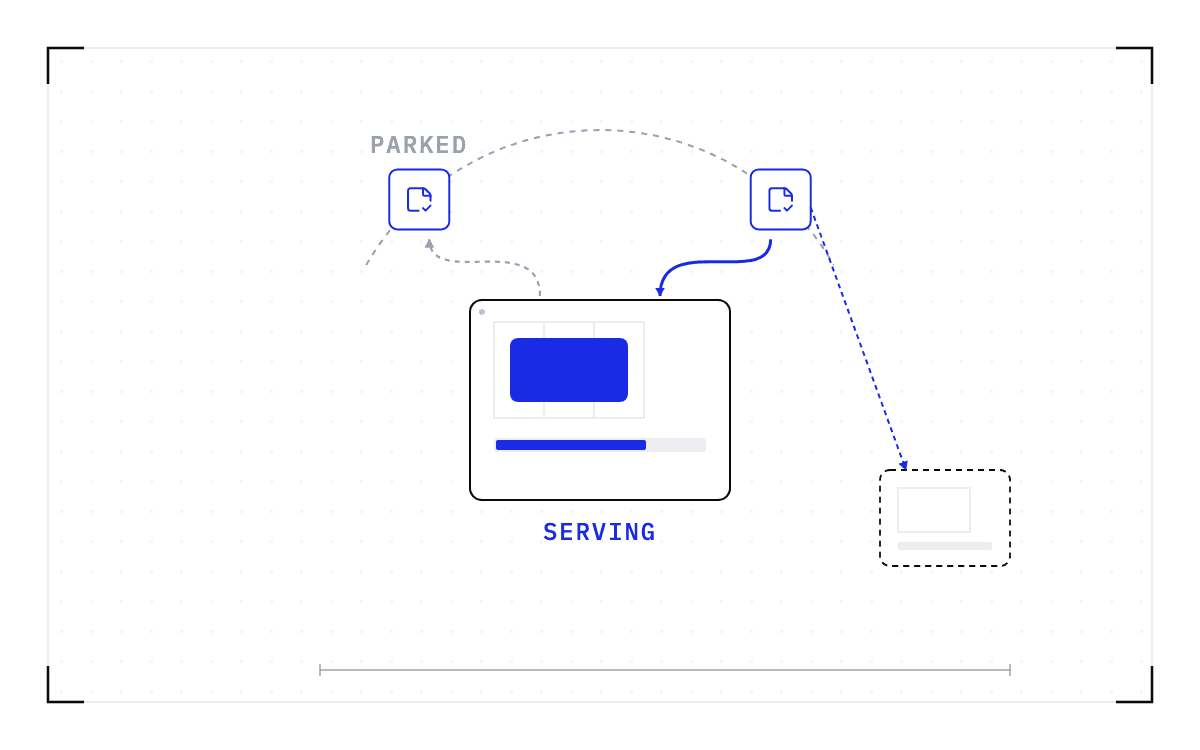
Cedana. Blueprint of one GPU card at the centre with a blue model block resident on it, and a dashed arc above it carrying two saved-state artifacts, the parked models. A grey dashed arrow leaves the card for the left artifact and a thick blue arrow comes in from the right one. A thin blue dashed line also runs from that artifact to a second, dashed GPU card at the lower right.How to swap models on one GPU without a cold start

How to swap models on one GPU without a cold start

Compare GPU model swaps using vLLM sleep mode, SGLang and checkpoint restore. Learn where parked state lives and what each swap still costs.

read →
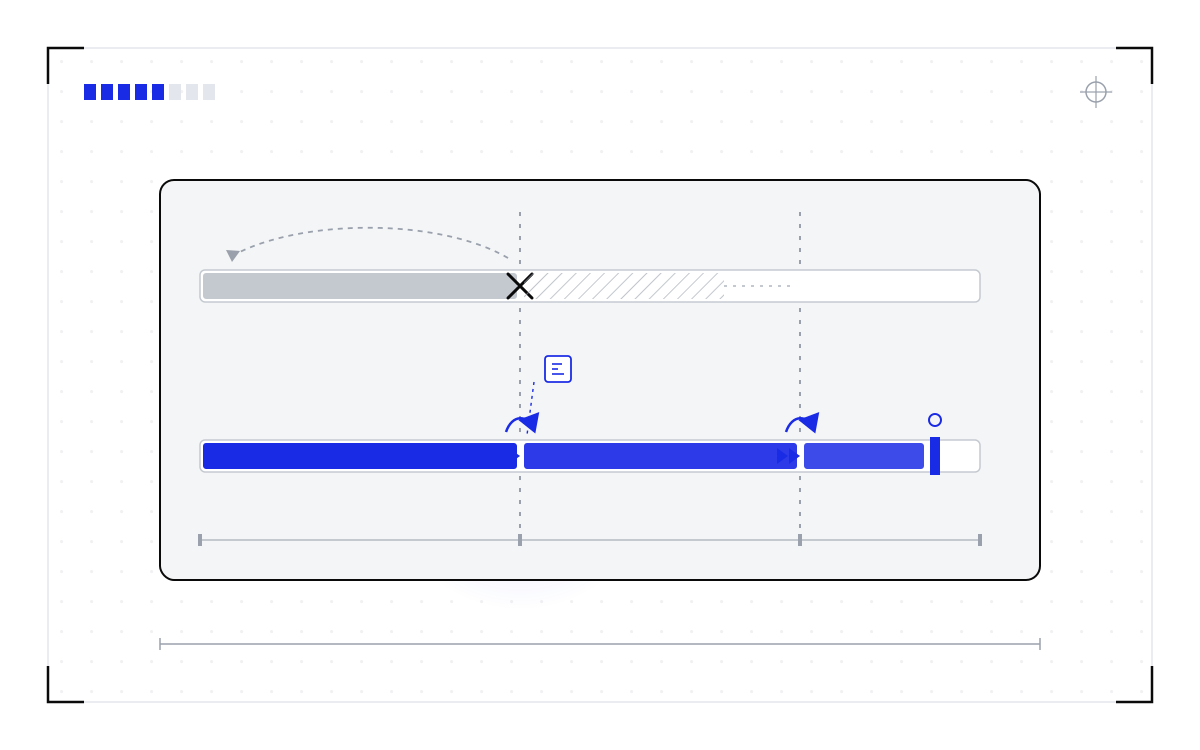
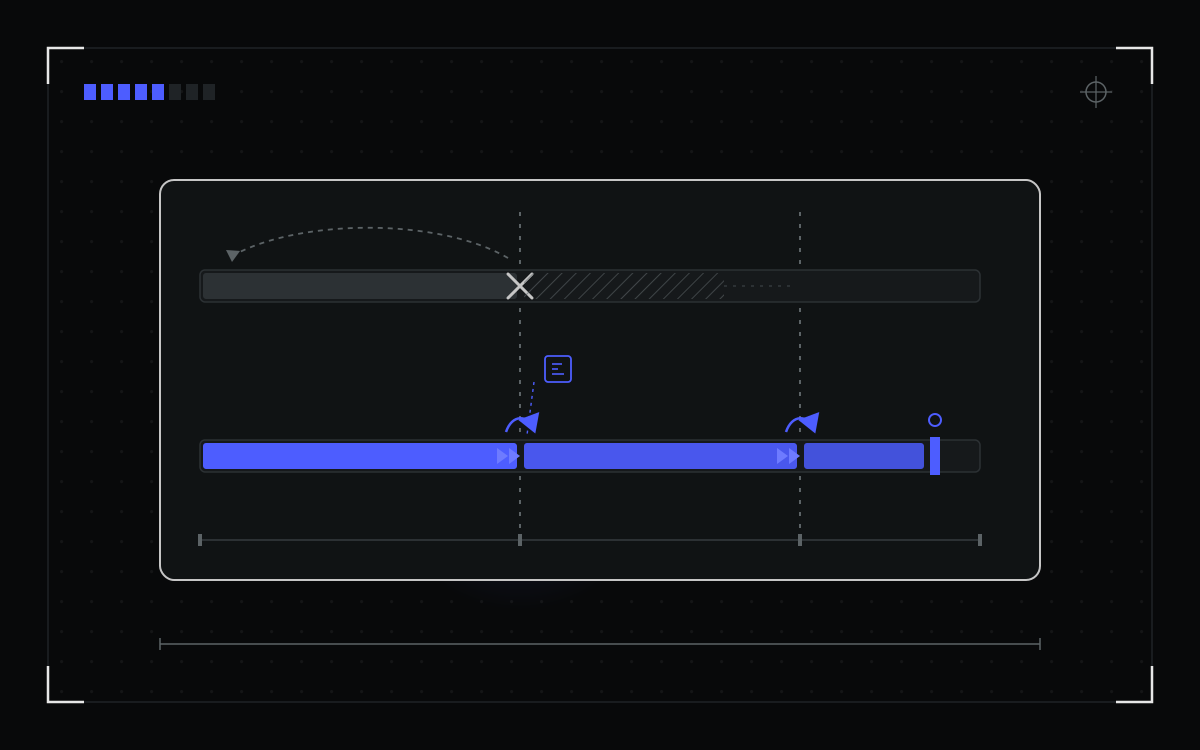
Blueprint timeline of two jobs crossing a 24-hour wall-time boundary: one is terminated and restarts from zero, the other checkpoints and continues into the next allocationBlueprint timeline of two jobs crossing a 24-hour wall-time boundary: one is terminated and restarts from zero, the other checkpoints and continues into the next allocation

The Wall-Time Limit Forces an Expensive Tradeoff in HPC.

Jobs reach their wall-time limits and lose hours or days of in-memory progress. However, the limit itself is not the problem.

read →
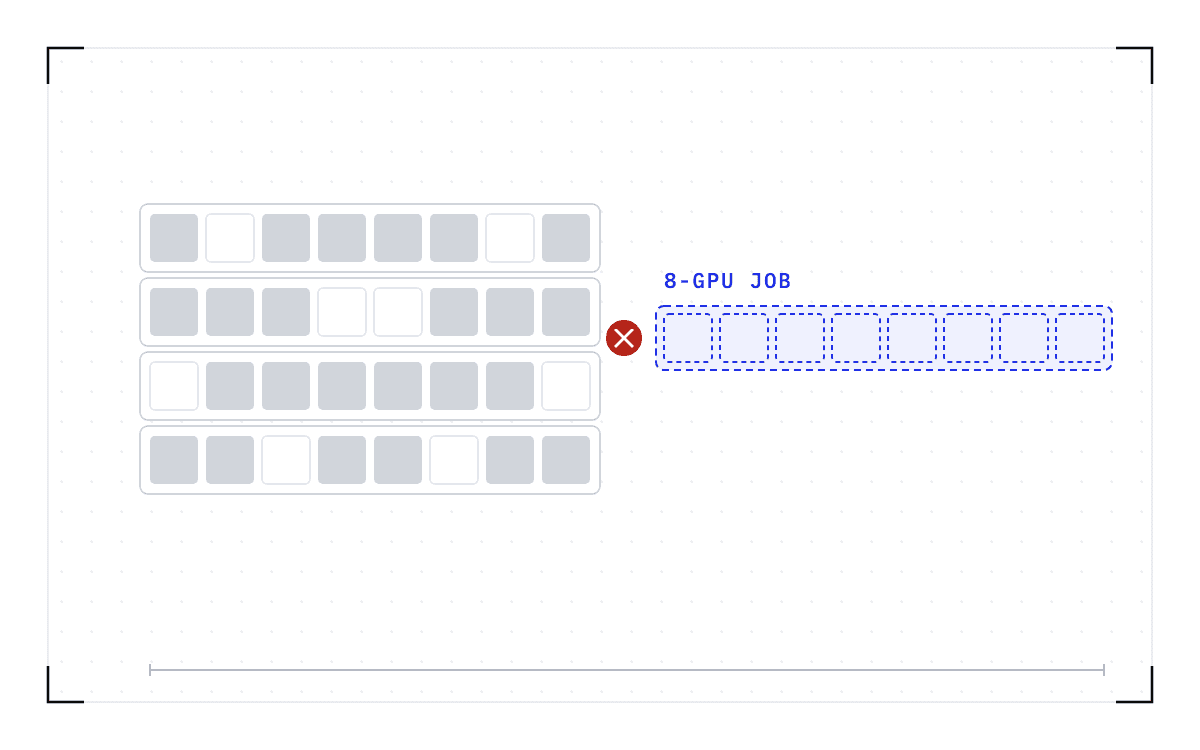
Cedana. Blueprint of four outlined node rows of eight GPU cells, grey where in use and white where free, with two free cells scattered in each row. To the right, one eight-cell job outlined in dashed blue, marked 8-GPU job, blocked by a red cross.Why a cluster with free GPUs still cannot place an 8-GPU job

Why a cluster with free GPUs still cannot place an 8-GPU job

See why scattered free GPUs cannot fit a large job, what bin packing and consolidation change, and why moving running state matters for defragmentation.

read →
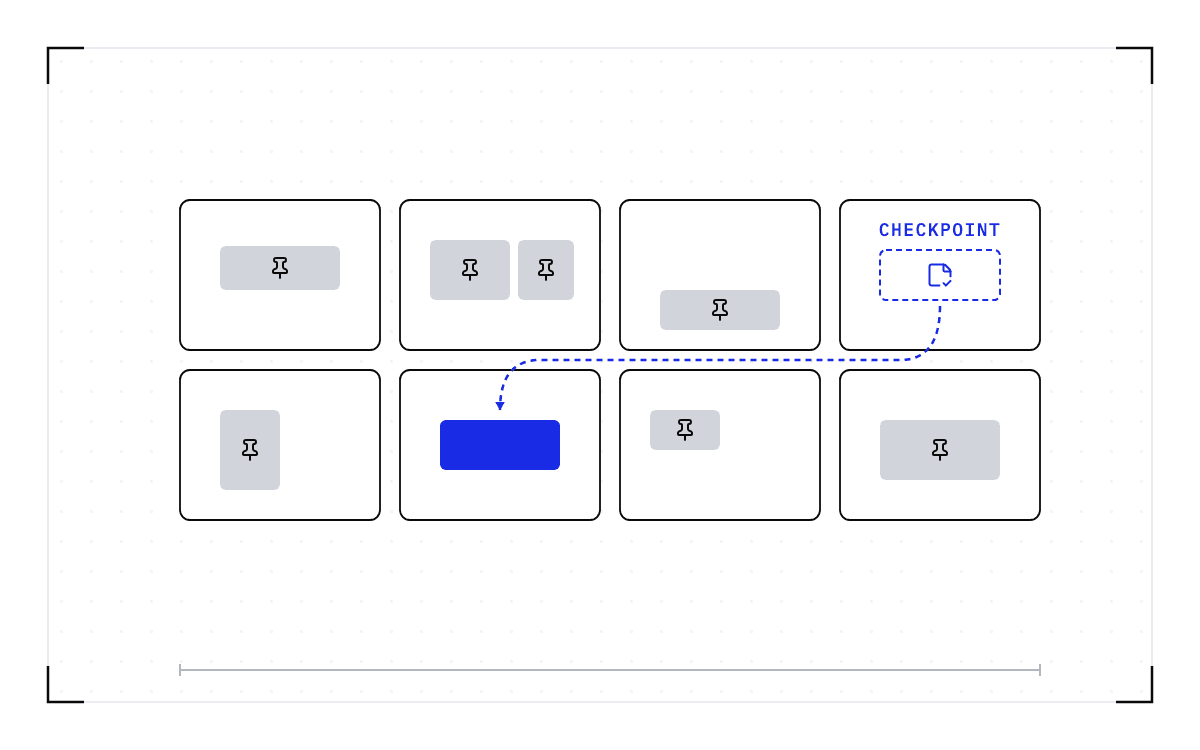
Cedana. Blueprint of a board of eight node rectangles in two rows, most holding grey job blocks each fixed with a black push-pin where it landed. One job in the top right is a dashed blue outline carrying a saved-state icon and no pin, with a long blue dashed arrow curving from it to a solid blue block that has landed in the one empty node in the row below.What would a GPU scheduler do differently if it could move running jobs?

What would a GPU scheduler do differently if it could move running jobs?

Compare how GPU schedulers handle placement, preemption and time limits, and what checkpointing could change once a job has already started.

read →
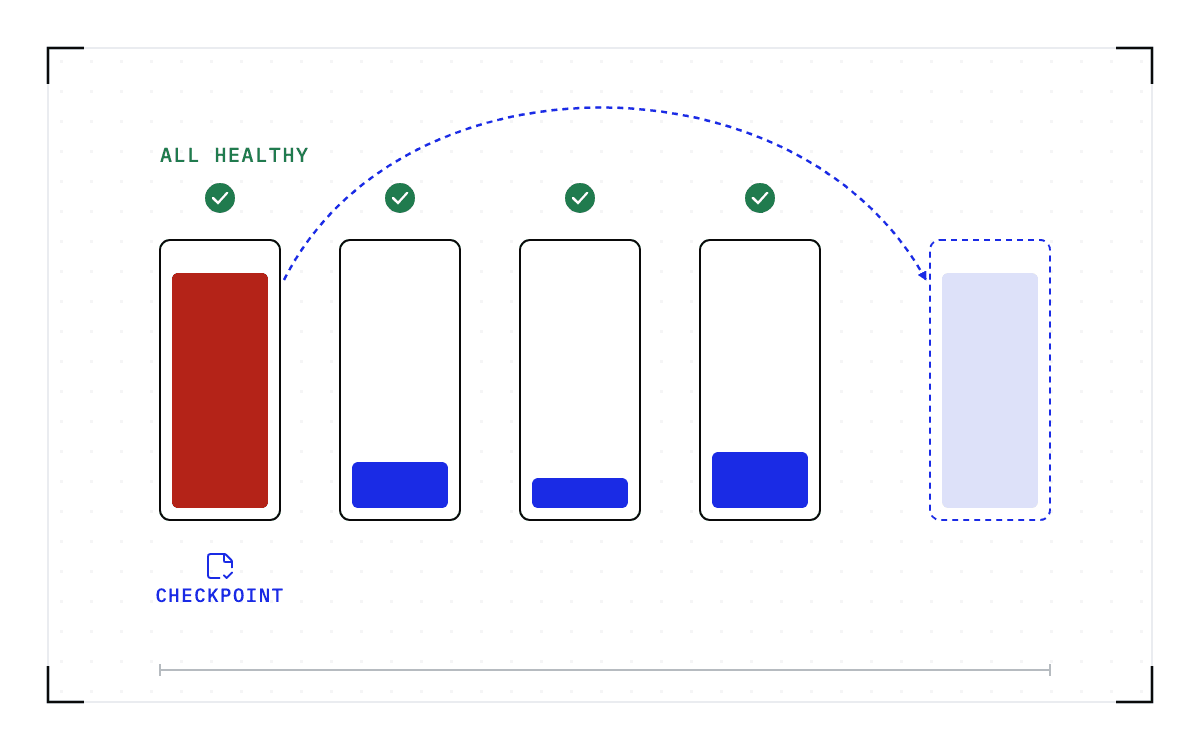
Cedana. Blueprint of four tall worker columns each under a green tick, marked all healthy. The first is filled almost to the top in red; the other three hold a shallow blue fill. A blue dashed arc carries the first worker to a fifth, dashed column at the right, filled pale blue to the same height, and a save icon marked checkpoint sits under the first column.Why a healthy inference worker can still be in the wrong place

Why a healthy inference worker can still be in the wrong place

Understand how GPU topology, decode load and hardware fit affect inference workers, and why admission-time placement cannot rebalance running sessions.

read →
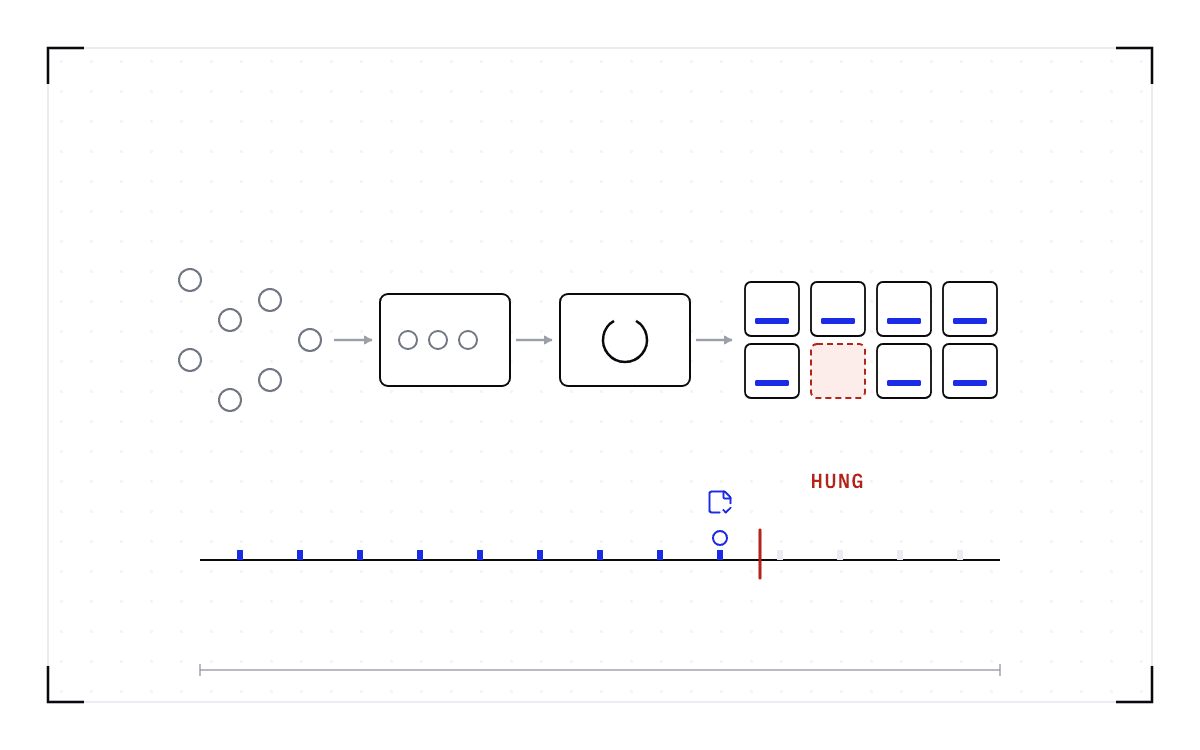
Cedana. Blueprint of a serving engine as a chain: a scatter of small request circles waiting on the left, an arrow into an API server box that already holds three, an arrow to an engine-loop box with a circular arrow inside, and an arrow to a grid of eight worker squares, seven with blue status bars and one filled pale red with a dashed red outline and no bar. Under the chain a timeline of blue heartbeat marks runs up to a red bar, the hang, with the last mark before it ringed under a saved-state icon.What to do when vLLM or SGLang stops responding and nothing crashed

What to do when vLLM or SGLang stops responding and nothing crashed

Separate a stalled serving engine from a hung GPU. Understand health-check limits and why recovery needs a checkpoint from before the engine stopped.

read →
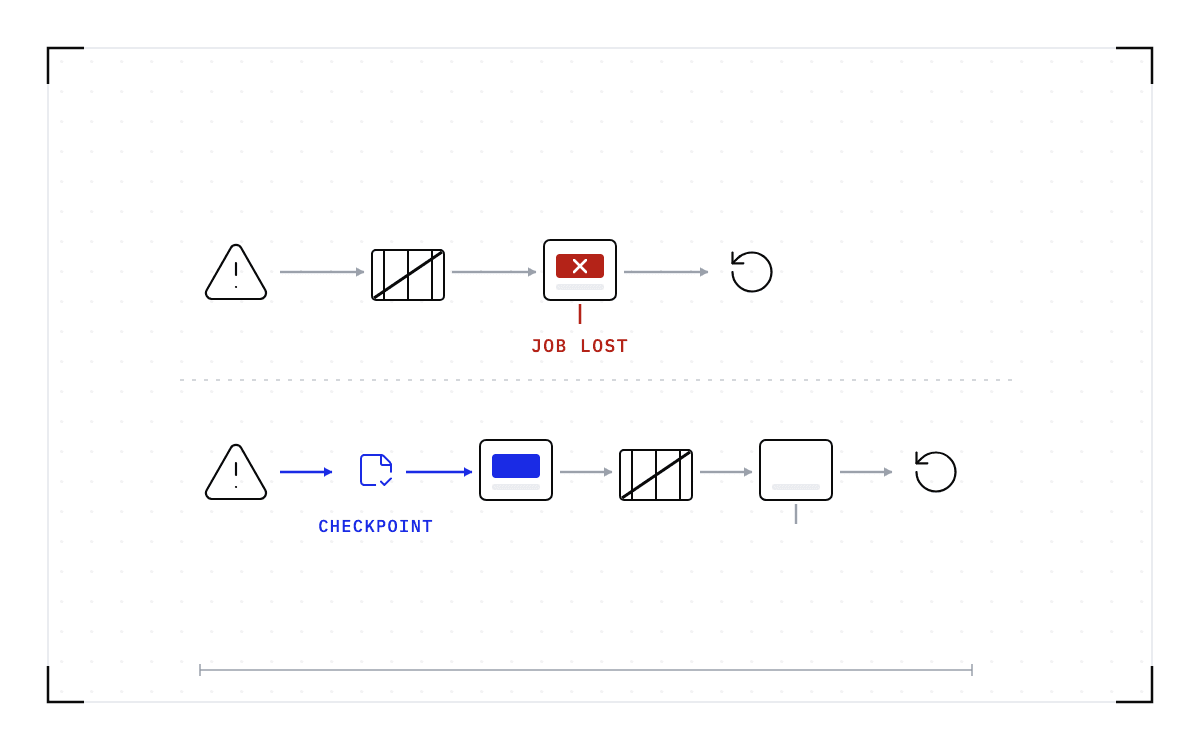
Cedana. Blueprint of two rows of the same steps in different orders. On top: a warning triangle, a cordon barrier, a node whose job is red and struck out as it drains, then a reset arrow. Below: the warning triangle, a blue saved-state icon, a healthy node holding the job in blue, then the cordon, an empty node draining, and the same reset arrow.What to do when DCGM flags a GPU that has a job running on it

What to do when DCGM flags a GPU that has a job running on it

Interpret DCGM and Xid alerts, distinguish repair from workload recovery, and decide which checkpoint to restore before draining a degraded GPU node.

read →
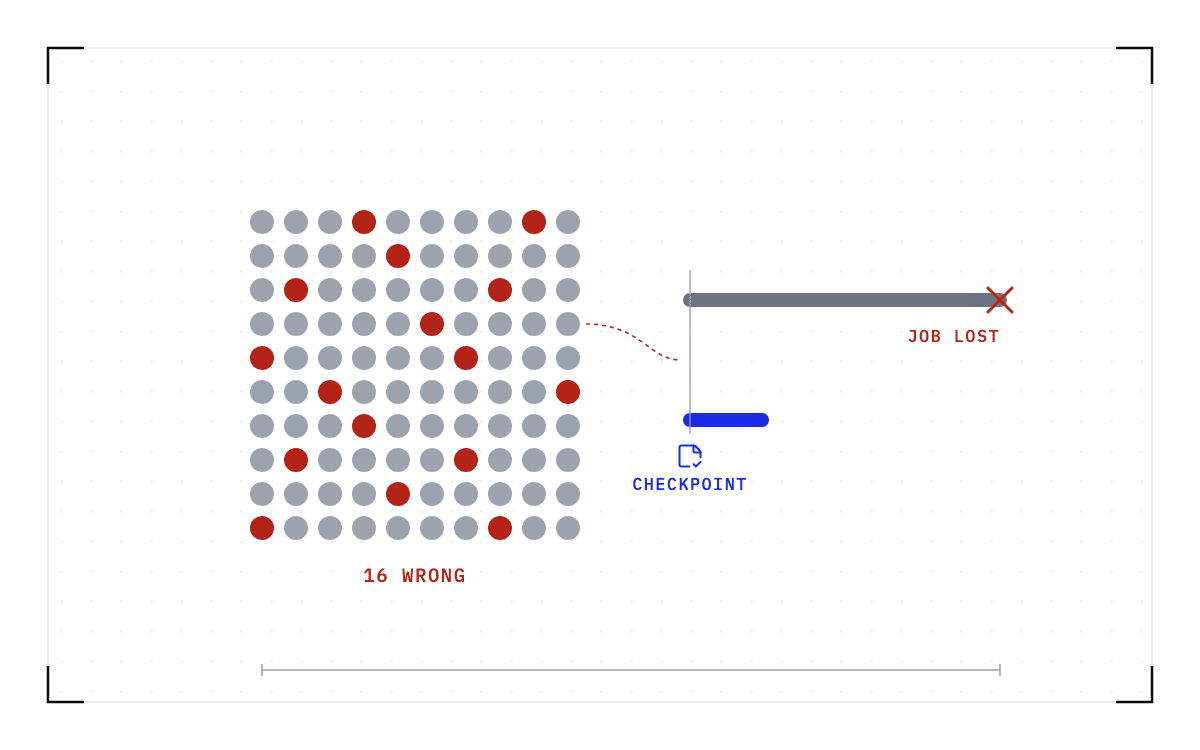
Cedana. Blueprint of a ten by ten grid of dots, eighty-four grey and sixteen red scattered among them, the wrong predictions in a hundred. To the right two thick bars from one baseline: a long grey bar ending in a red cross, what each wrong one costs today, and a short blue bar under a saved-state icon, what it costs when acting means a restore.Is it worth acting on a GPU failure prediction?

Is it worth acting on a GPU failure prediction?

Assess GPU failure predictions using precision, warning time and the cost of acting. Understand what checkpoints change and which failures give no warning.

read →
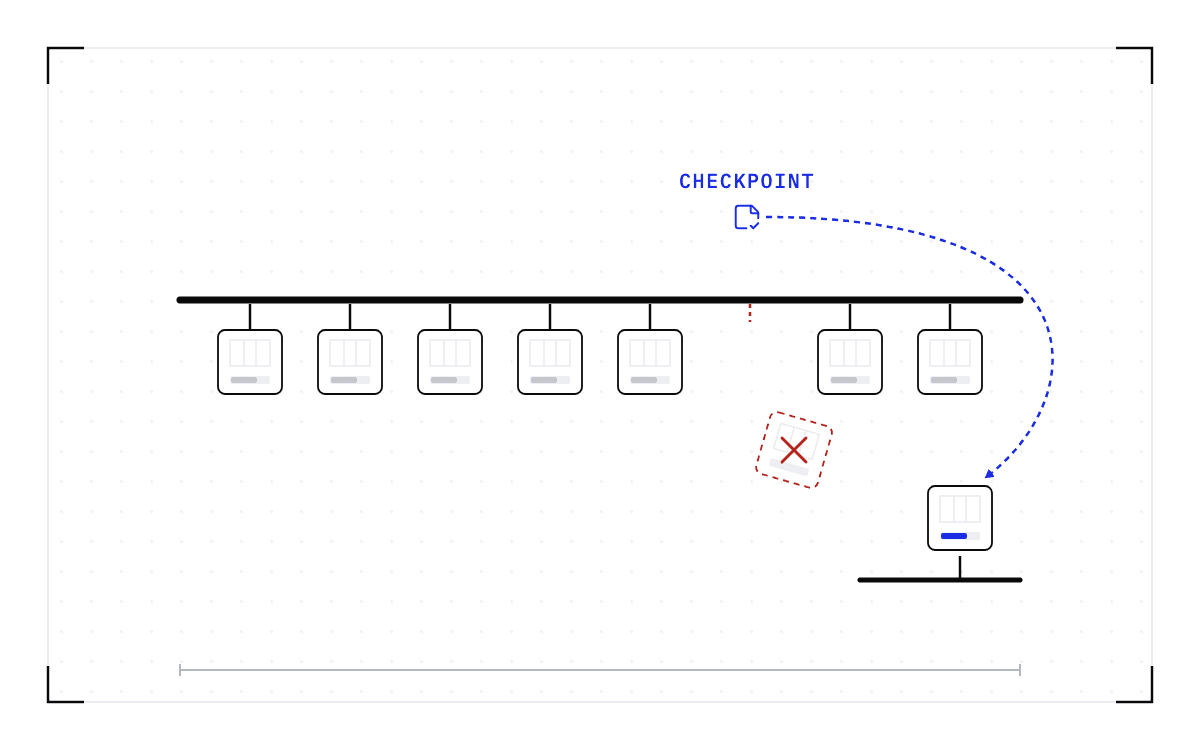
Cedana. Blueprint of a thick horizontal bus with eight GPU cards hanging from it on short stems, their status bars grey. One stem is broken into red dashes and its card has dropped away below the row, tilted, outlined in dashed red and struck out. From a saved-state icon above the bus a blue dashed arrow curves down to a ninth card on a second, shorter bus at the lower right, its status bar blue.What happens to a training job when a GPU fails

What happens to a training job when a GPU fails

Understand Xid faults, GPU resets and the state a training job loses. Learn why recovery depends on a checkpoint taken before the hardware fails.

read →
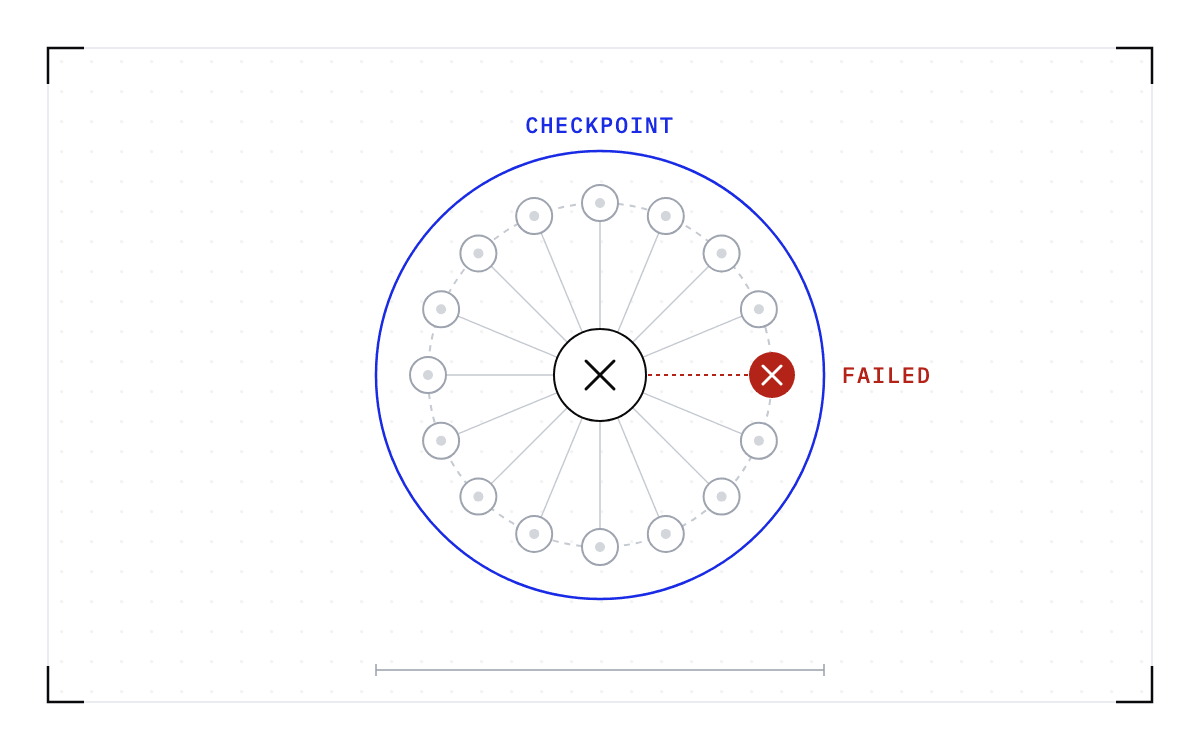
Cedana. Blueprint of sixteen GPUs in a ring as one training group, one filled red and struck out, the ring joining them broken into dashes, and the collective at the hub struck out. A blue ring encloses the whole group.One node failed and the whole training job died

One node failed and the whole training job died

Learn why one failed rank stops a distributed training job, what NCCL timeouts mean, and how checkpoint state determines what a restart can recover.

read →
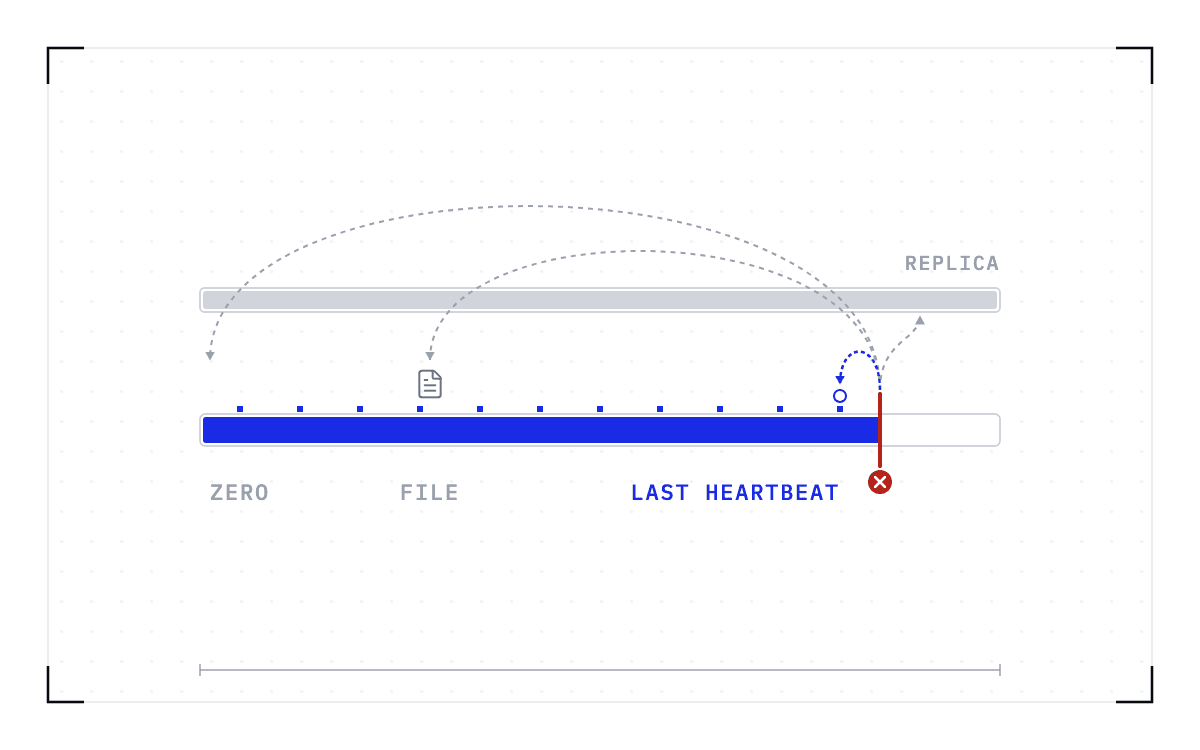
Cedana. Blueprint of a long progress track filled blue up to a red cut, with small blue heartbeat marks along it and a grey document icon standing some way back. From the cut, grey dashed arcs loop back to the very start of the track and to the document, another climbs to a second grey lane above that runs on unbroken, and a short blue arc drops to the last heartbeat mark just before the cut.What torchrun, torchft and Ray Train restart from when a node dies

What torchrun, torchft and Ray Train restart from when a node dies

Compare how torchrun, torchft, Ray Train and Kubeflow recover after a node fails, including saved state, code changes and checkpoint intervals.

read →
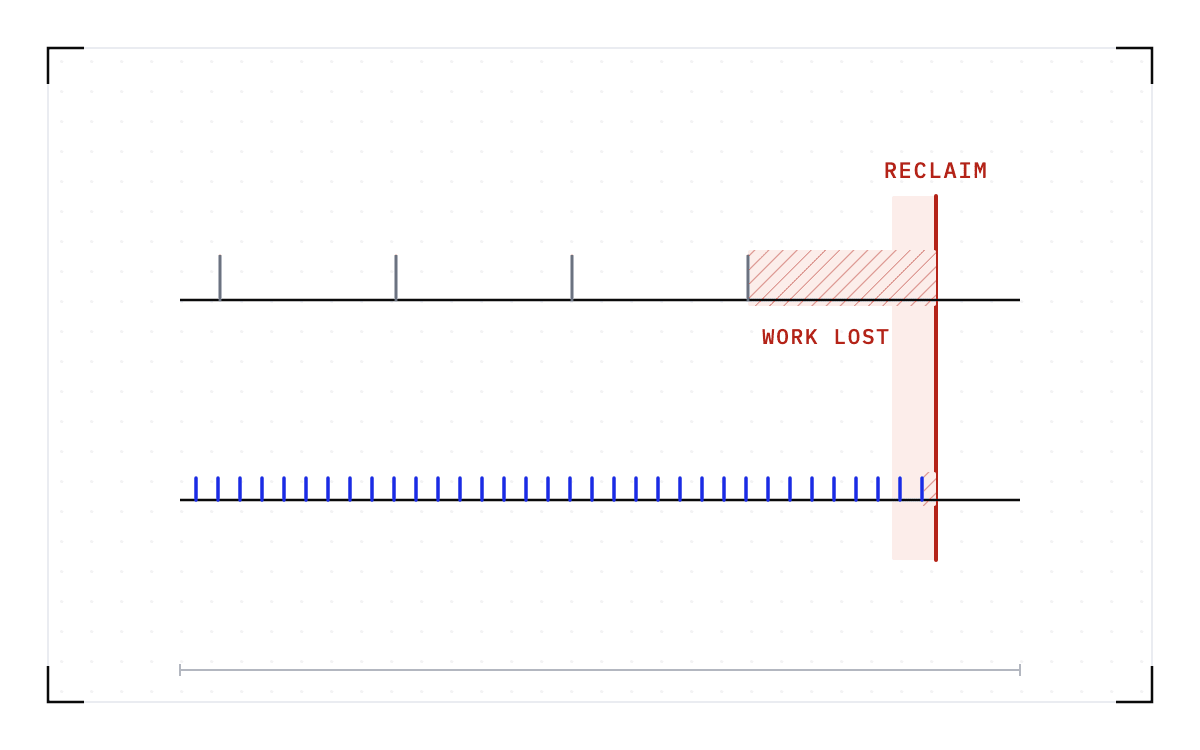
Cedana. Blueprint of two tracks of one job ending at the same red line marked reclaim, with a pale red band just before it. On the top track the tick marks are far apart and a red hatched block marked work lost runs back the whole interval. On the bottom track the blue ticks are dense and the hatched loss is a sliver.What happens to a training job when a spot instance is reclaimed

What happens to a training job when a spot instance is reclaimed

Compare spot interruption windows and recovery costs for GPU training. Learn what must be saved before reclaim and when spot remains worth using.

read →
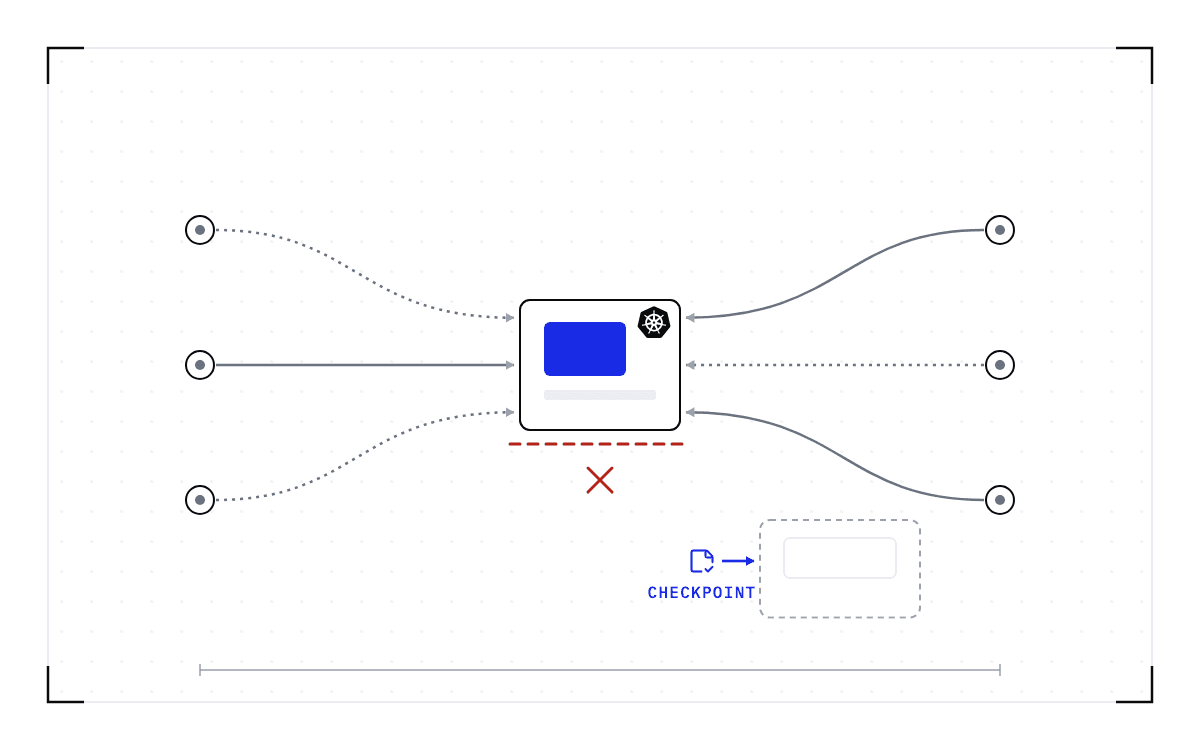
Cedana. Blueprint of one pod at the centre holding a blue block of GPU memory, with six lines converging on it from small circles at the left and right edges, some solid and some dashed, each ending in an arrowhead. Beneath the pod its floor is a red dashed line over a red cross. Lower right, a dashed outline of a replacement pod with an empty slot, and a blue saved-state icon pointing into it.What happens to a GPU pod when Kubernetes ends it

What happens to a GPU pod when Kubernetes ends it

Compare the ways Kubernetes ends GPU pods, the warning each path provides, and what checkpoint recovery needs after eviction or spot-node termination.

read →
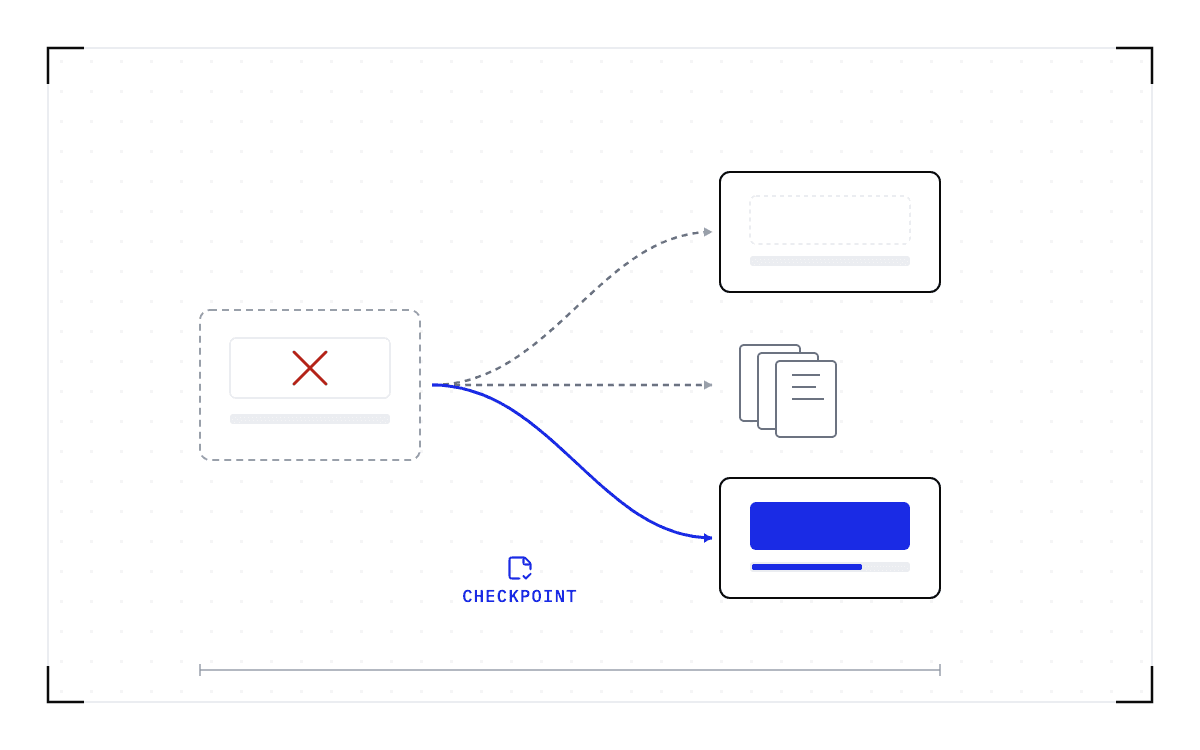
Cedana. Blueprint of a dashed, struck-out instance on the left with three lines leaving it to the right: two grey dashed lines to an empty machine outline and to a small stack of documents, and one solid blue line, through a saved-state icon, to a machine holding the job in blue as it was running.What SkyPilot, Ray Train, SageMaker and MemVerge bring back after a spot reclaim

What SkyPilot, Ray Train, SageMaker and MemVerge bring back after a spot reclaim

Compare spot recovery tools by the machines, files or running state they restore, the checkpoint code they require and their published limits.

read →
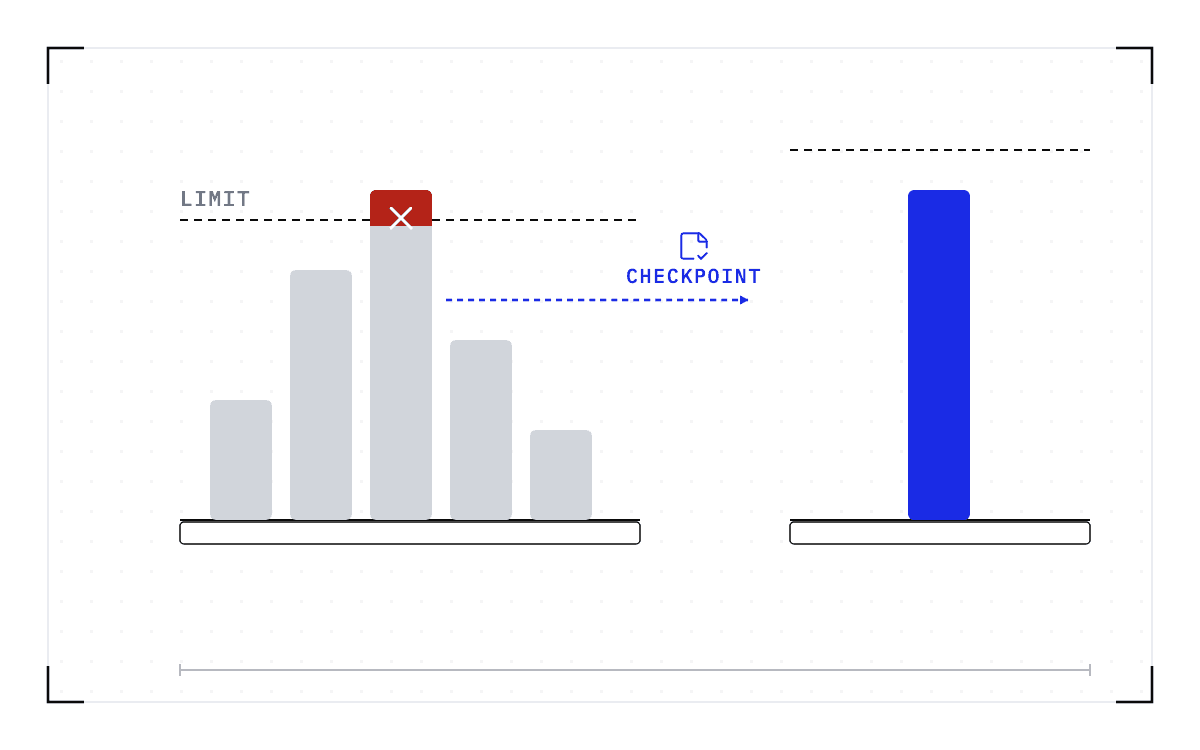
Cedana. Blueprint of five process columns on one node under a dashed line marked limit; the tallest breaches the line, its top painted red and struck out. A blue dashed arrow carrying a save icon marked checkpoint leads right to a second node whose dashed limit sits higher, where the same column stands in blue with room above it.What happens when a cluster job runs out of memory

What happens when a cluster job runs out of memory

Identify which memory limit killed your cluster job, where to find the evidence, and why recovery requires state saved before the OOM kill.

read →
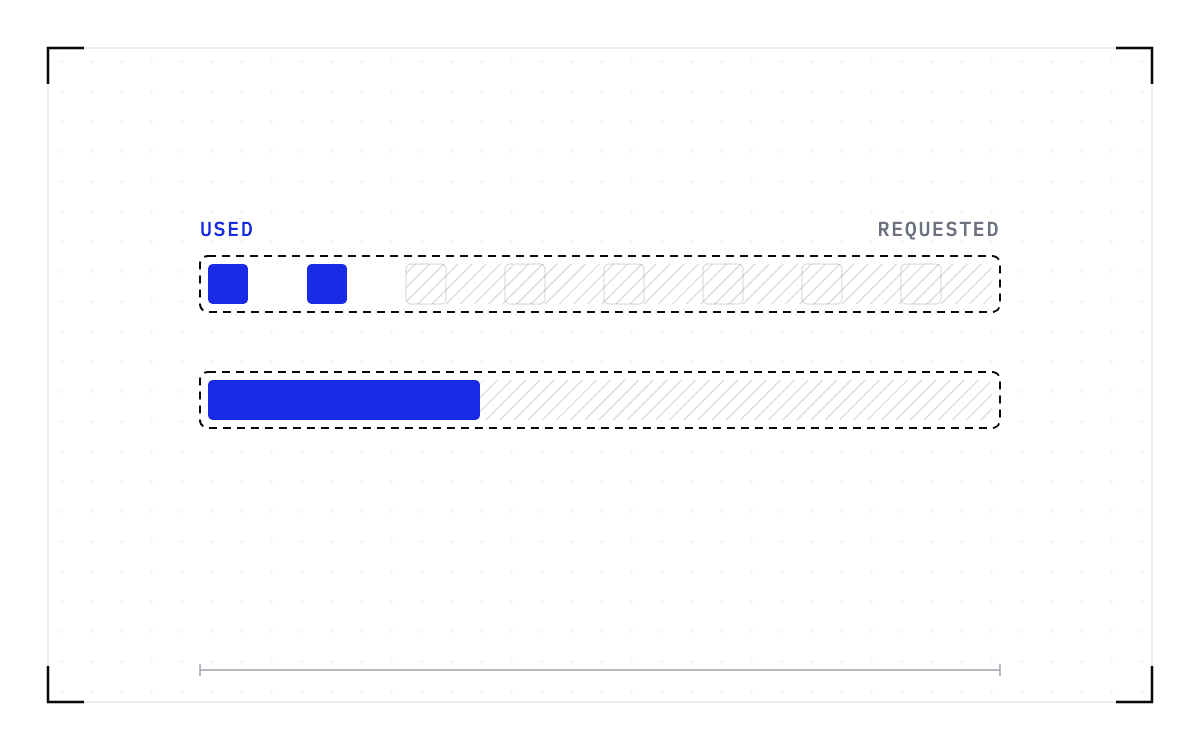
Cedana. Blueprint of two long dashed outlines marked requested, each holding a solid blue fill marked used: a row of eight GPU cells with only two lit and the rest hatched, and a memory bar filled a third of the way with the remainder hatched.Why everyone over-requests memory on a shared cluster

Why everyone over-requests memory on a shared cluster

Understand why cluster users request extra memory, how Slurm limits and sampled peaks affect sizing, and what changing an allocation costs.

read →
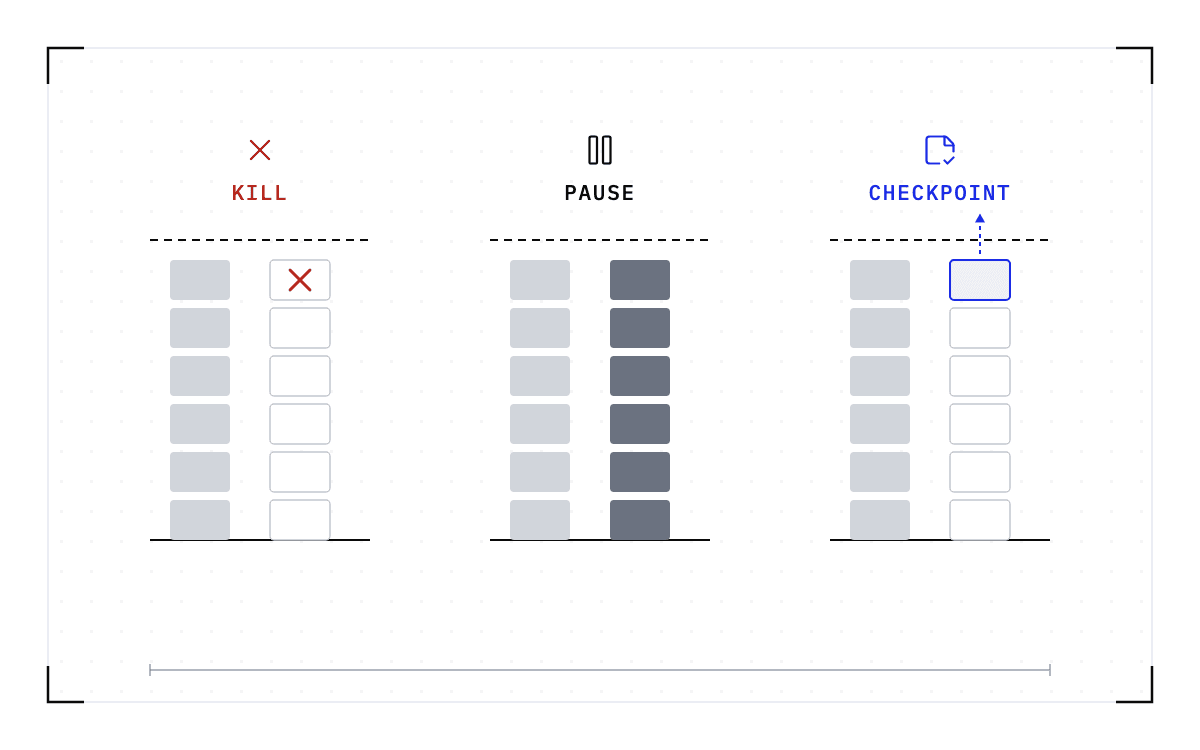
Cedana. Blueprint of three panels headed by an icon and a word: a red cross marked kill, a pause glyph marked pause, a blue save icon marked checkpoint. Each panel is a machine's memory stacked to a dashed limit with a process column beside it: emptied and struck out under kill, still dark and full under pause, and emptied with its top block rising in blue to the save icon under checkpoint.Can Linux pause a process instead of killing it when memory runs out?

Can Linux pause a process instead of killing it when memory runs out?

Learn why pausing a process does not free RAM, what earlyoom and systemd-oomd can do, and when checkpointing must act to preserve running work.

read →
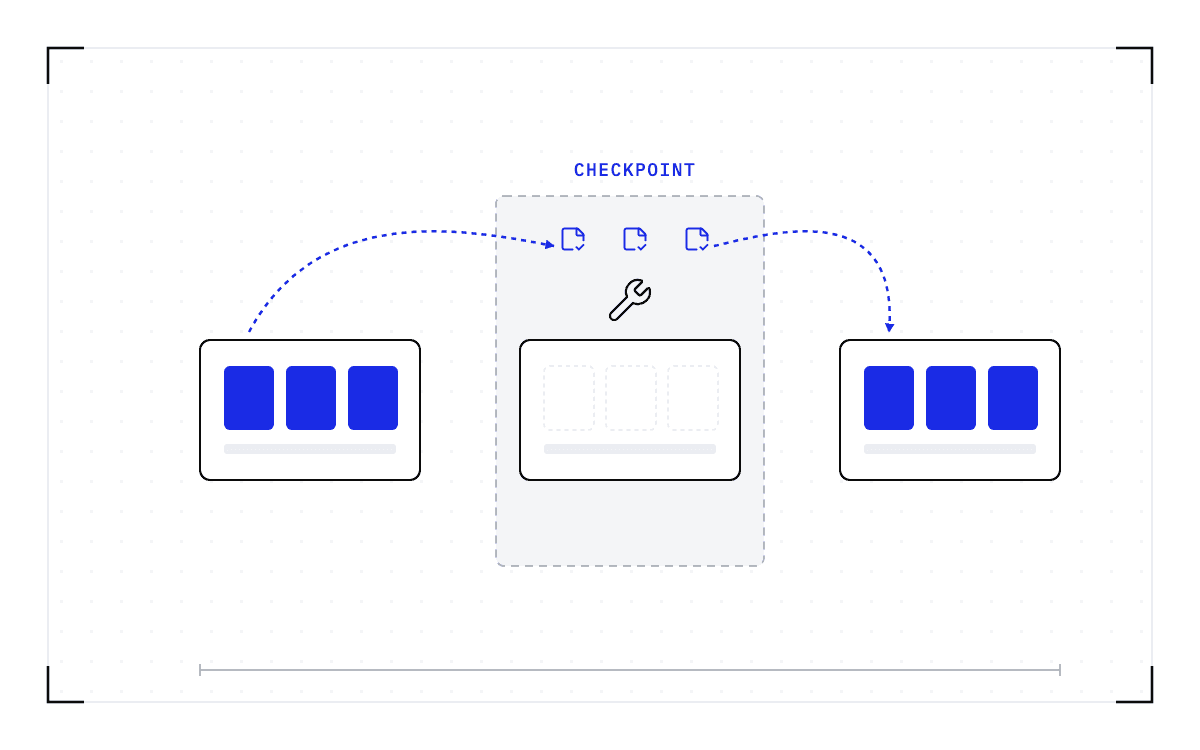
Cedana. Blueprint of the same node drawn three times in a row: on the left holding three blue session blocks, in the middle standing empty inside a dashed grey window with a nut-and-spanner mark above it, on the right holding the three blue blocks again. Three saved-state icons sit above the empty node, and blue dashed arrows carry the sessions up from the first node into them and down from them into the third.Draining a GPU node in Kubernetes without losing the work on it

Draining a GPU node in Kubernetes without losing the work on it

Understand what a Kubernetes drain does to GPU pods, how disruption budgets affect it, and how to plan checkpoint and restore around maintenance.

read →
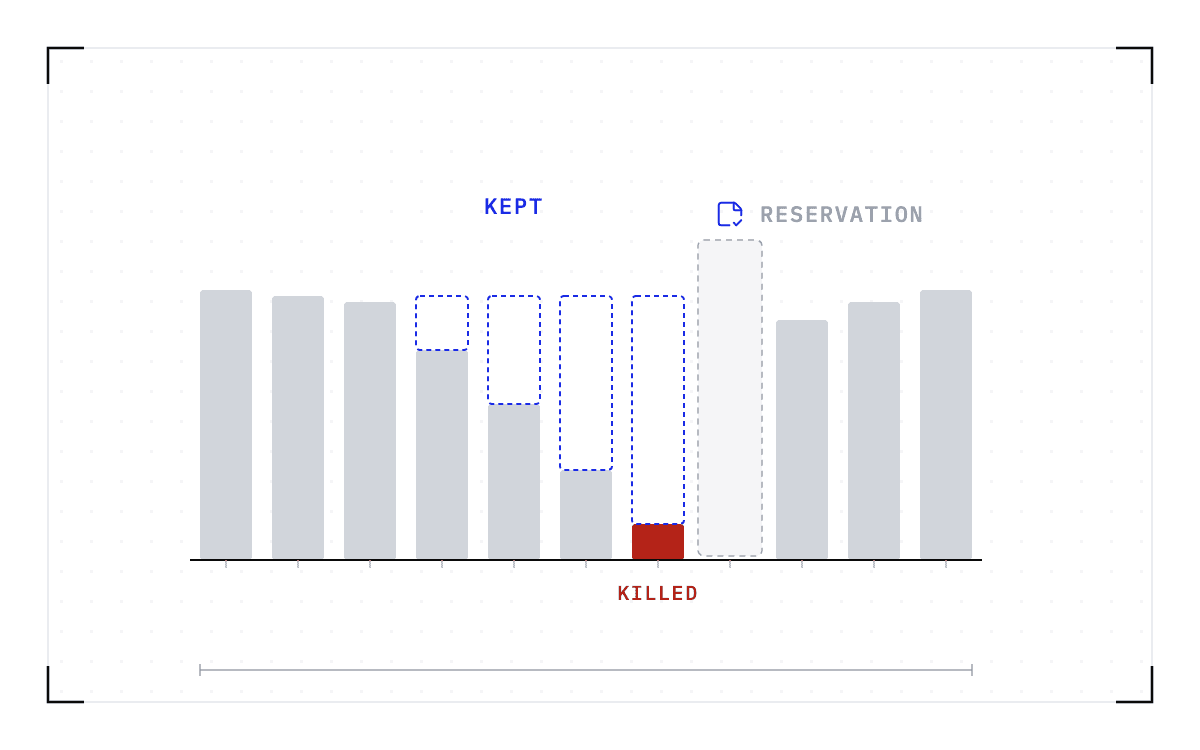
Cedana. Blueprint of a bar chart of node occupancy by day: high grey bars that fall step by step over four days to almost nothing at a dashed grey window, then climb again after it. The last sliver before the window is red and struck out. Blue dashed outlines stand on top of the falling bars up to the height they would have kept, and a saved-state icon sits above the window.Rebooting Slurm nodes for a kernel update without losing the running jobs

Rebooting Slurm nodes for a kernel update without losing the running jobs

Compare Slurm reboot and reservation workflows, account for the idle time before maintenance, and plan checkpoint recovery around a kernel update.

read →
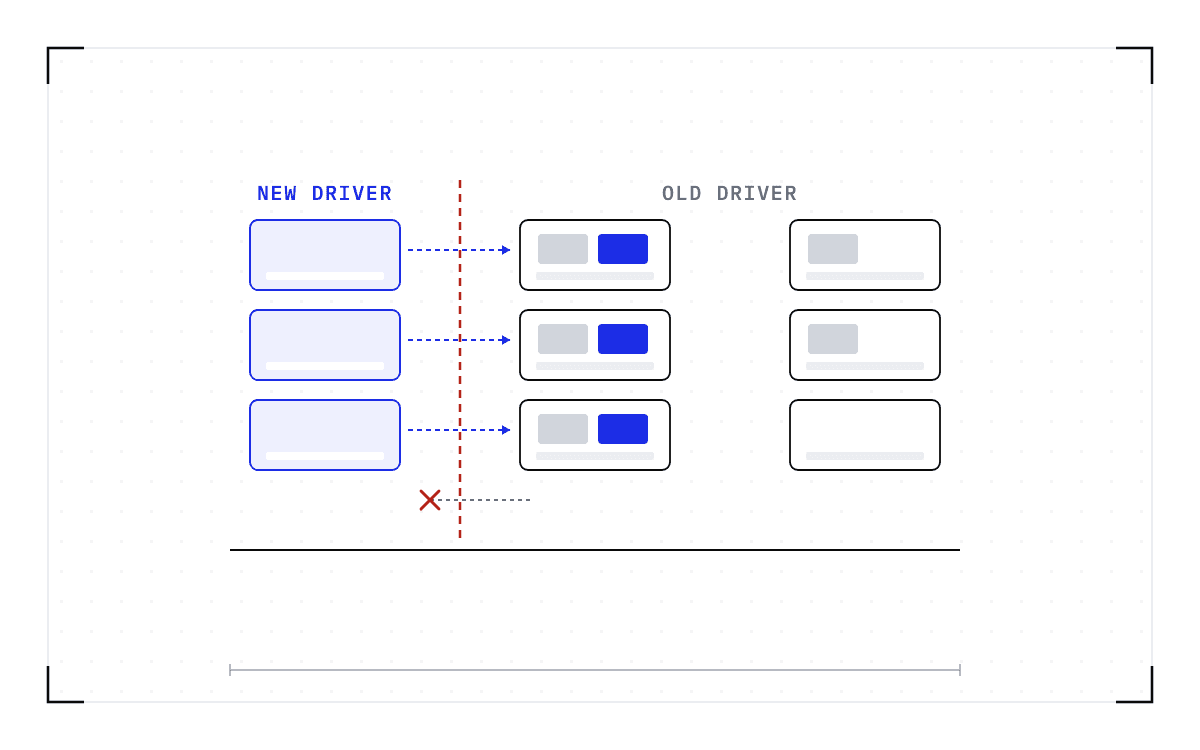
Cedana. Blueprint of three columns of three nodes. The left column is tinted blue and empty, freshly upgraded. The middle and right columns are outlined in ink and hold grey work blocks, with a blue block beside each grey one in the middle column where work arrived from the left along blue dashed arrows. A red dashed line runs between the left column and the rest, and a grey arrow trying to cross it back ends in a red cross.Why an NVIDIA GPU Operator upgrade waits for your workloads

Why an NVIDIA GPU Operator upgrade waits for your workloads

Learn why GPU Operator upgrades wait for active workloads, what causes driver pods to stall, and how compatibility limits shape a rolling upgrade.

read →
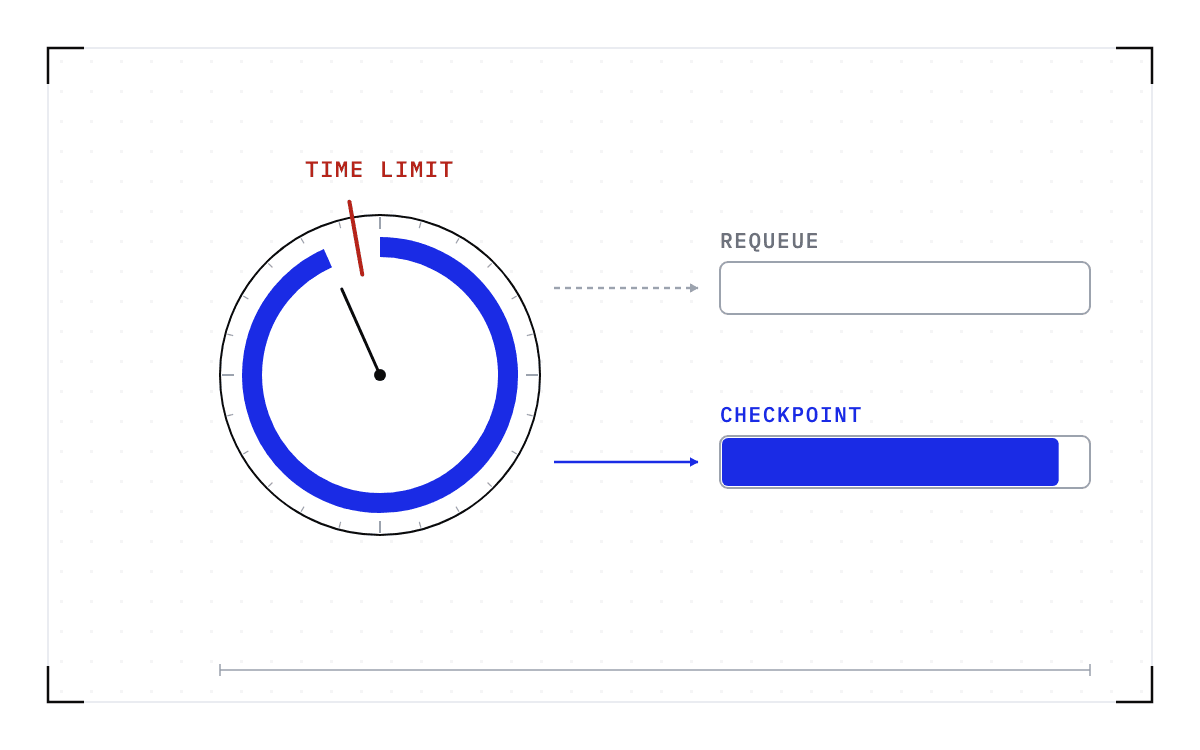
Cedana. Blueprint of an allocation drawn as a clock face, a thick blue arc of work running almost the whole way round to a red cut marked time limit. Two arrows leave to the right: a grey dashed one to an empty bar labelled requeue, and a blue one to a bar filled almost full, labelled checkpoint.Your Slurm job was cancelled due to time limit. What to do now

Your Slurm job was cancelled due to time limit. What to do now

Confirm a Slurm TIMEOUT, check what progress survived, and compare checkpoints, requeue and job chains for runs that exceed the wall-time limit.

read →
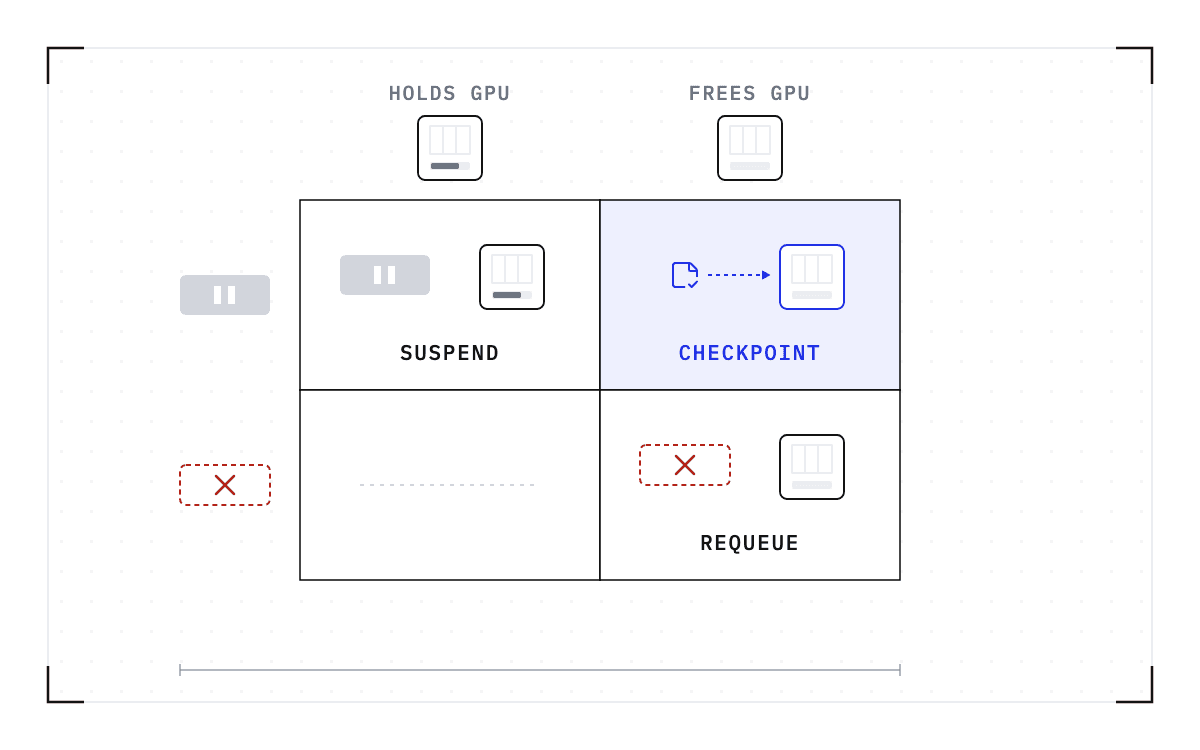
Cedana. Blueprint of a two-by-two grid. Along the top, a GPU card with its bar filled and one with its bar empty; down the side, a job block with a pause mark and a red dashed job block struck out. The top-left cell holds the paused job with the held GPU; the bottom-right holds the struck-out job with the freed GPU; the bottom-left is a faint dash; and the top-right, tinted blue, holds a saved-state icon with an arrow to a freed GPU outlined in blue.Slurm has no suspend option for GPU jobs. What preemption without killing the job looks like

Slurm has no suspend option for GPU jobs. What preemption without killing the job looks like

Learn why Slurm suspend keeps GPUs allocated, how requeue and grace time work, and where checkpointing can preserve a preempted job's progress.

read →
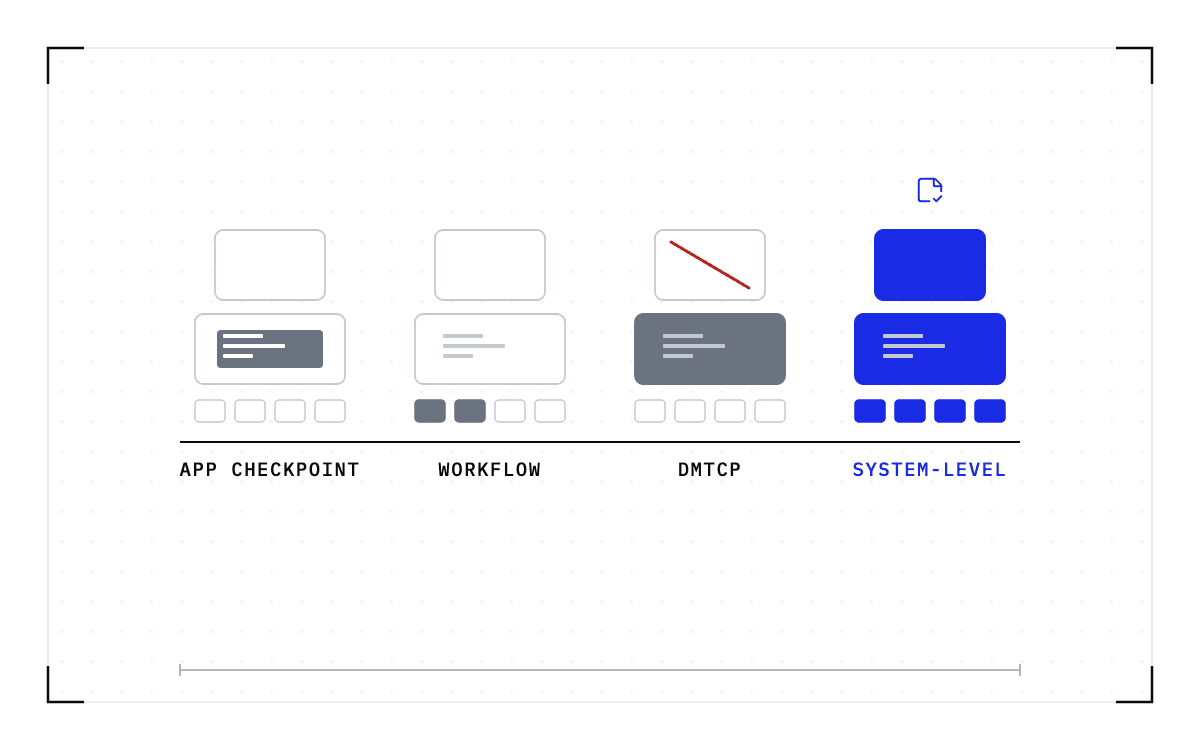
Cedana. Blueprint of the same workload silhouette four times in a row: a GPU card over a wider process box holding lines of a program, over a short pipeline of four small steps. In the first only a dark strip inside the process is filled. In the second the first two pipeline steps are filled and the third is dashed. In the third the process box is filled dark and a red slash crosses the GPU card. In the fourth every part is solid blue under a saved-state icon.DMTCP, application checkpoints, workflow managers and system-level checkpointing: what each covers on a Slurm cluster

DMTCP, application checkpoints, workflow managers and system-level checkpointing: what each covers on a Slurm cluster

Compare application checkpoints, workflow resume, DMTCP and system-level GPU checkpoints for Slurm jobs, including setup responsibilities and limits.

read →
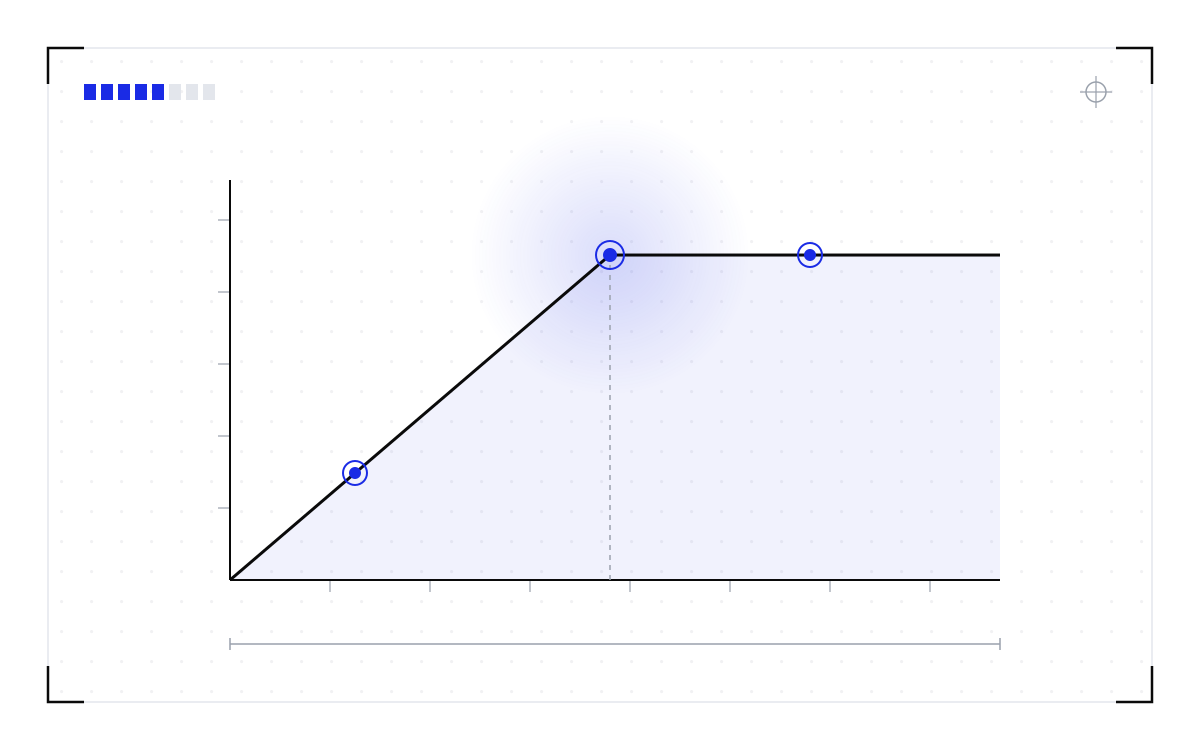
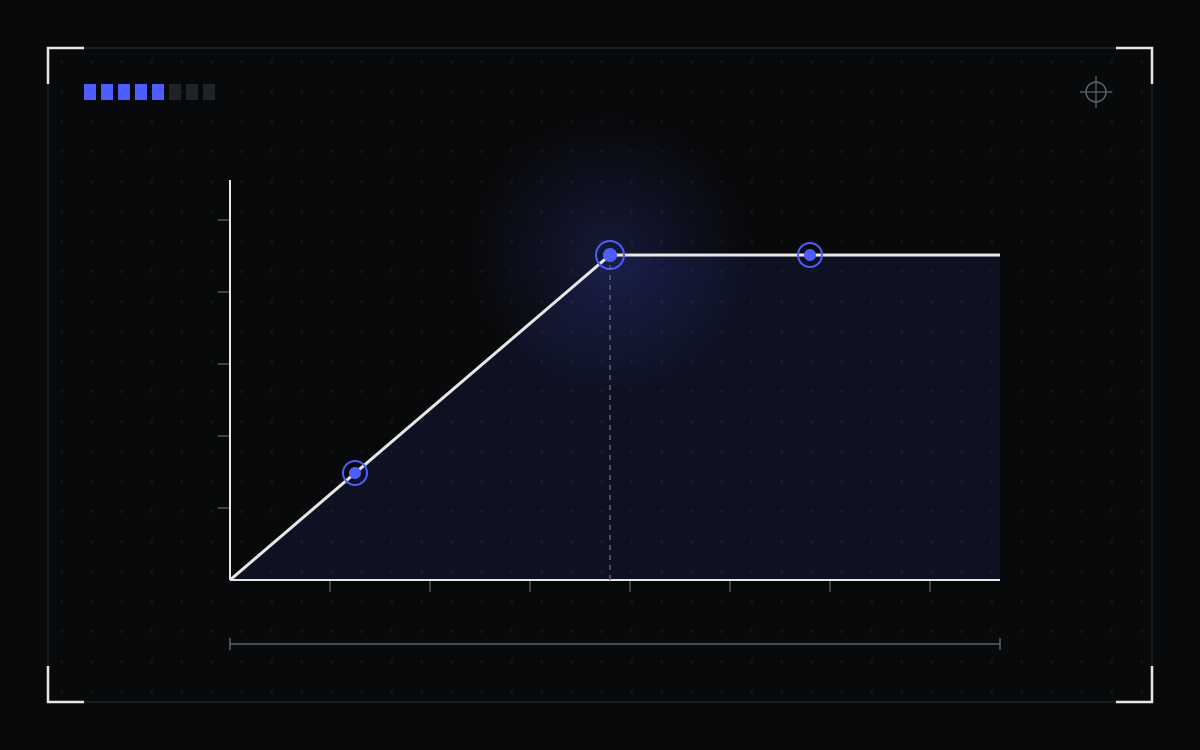
Blueprint roofline plot: performance rises along the memory-bandwidth slope to a ridge point, then flattens at the compute ceilingBlueprint roofline plot: performance rises along the memory-bandwidth slope to a ridge point, then flattens at the compute ceiling
Updated

Roofline Analysis and the Inference Value Chain

Once you stop renting intelligence, you own performance.

read →
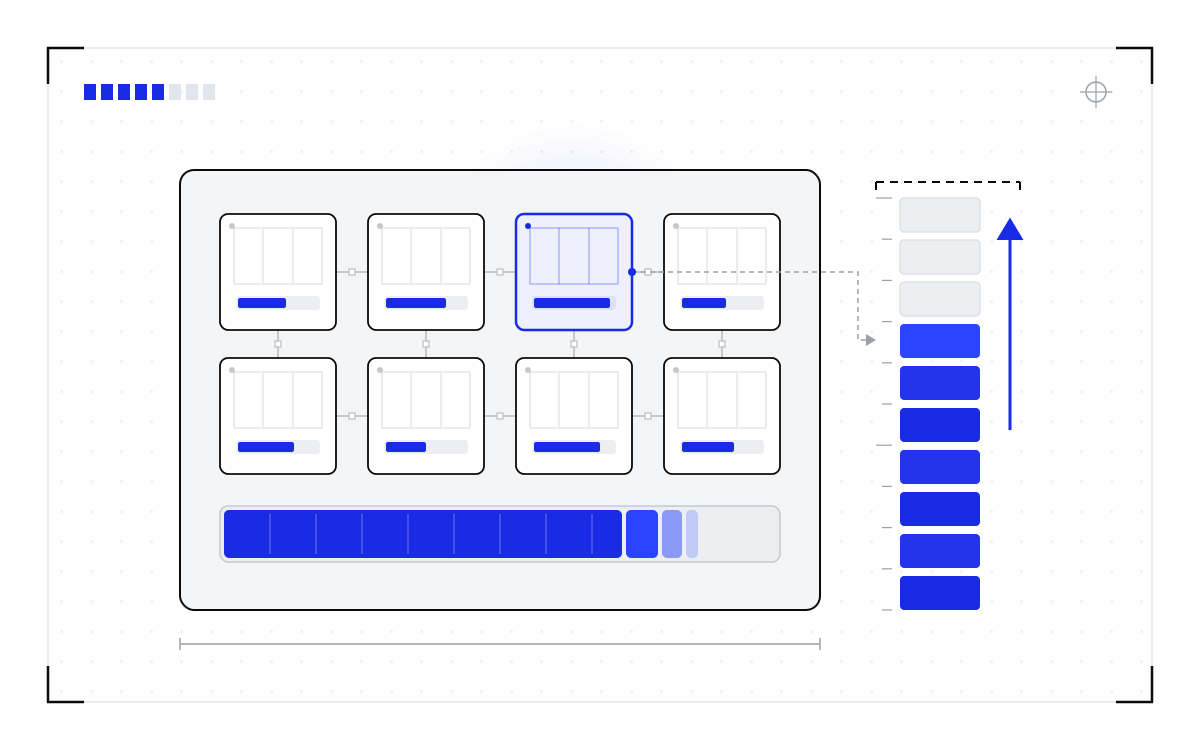
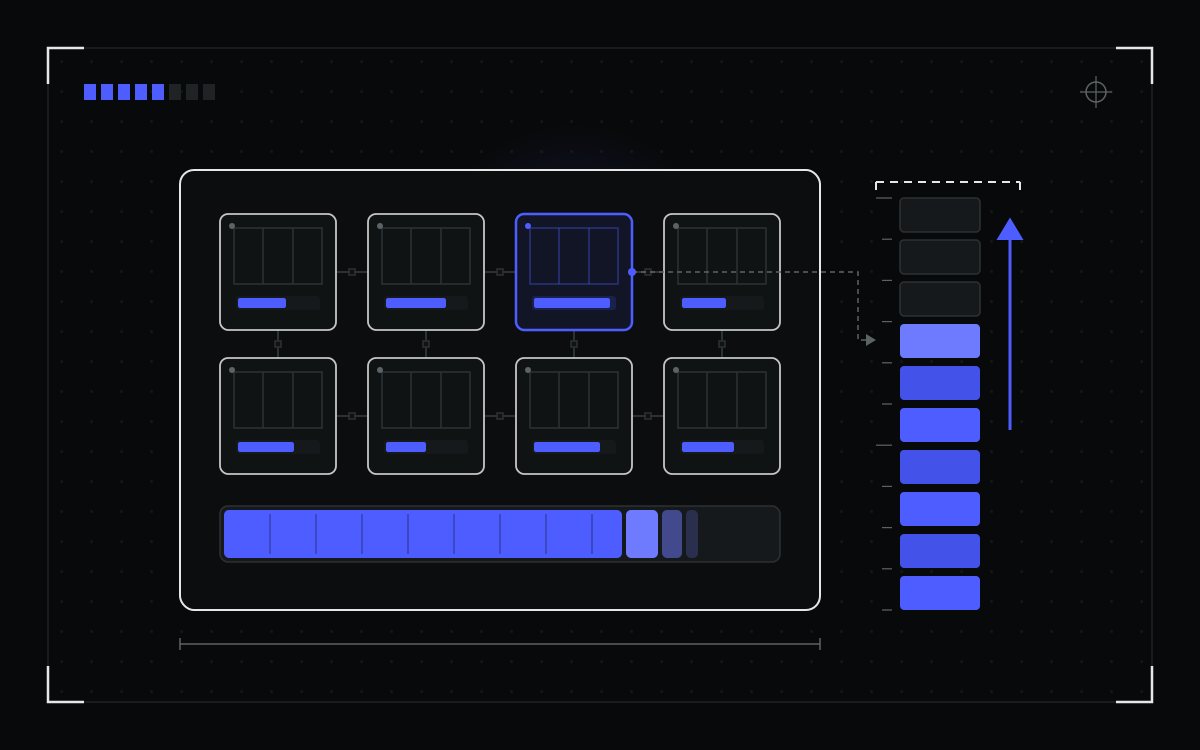
Blueprint schematic of an eight-GPU node accumulating session state, with a state gauge rising toward the VRAM capacity lineBlueprint schematic of an eight-GPU node accumulating session state, with a state gauge rising toward the VRAM capacity line
Updated

The Era of Stateful Inference: How to Improve Cost per Token.

We are entering the stateful inference era, driven by frontier models with longer context windows, longer in-flight sessions, and single instances spanning 8, 16, or more GPUs.

read →
Blueprint fleet of GPU cells with only a third lit, next to a utilization gauge stuck at a dashed 30 percent ceiling and a second gauge breaking through itBlueprint fleet of GPU cells with only a third lit, next to a utilization gauge stuck at a dashed 30 percent ceiling and a second gauge breaking through it
Updated

The Utilization Ceiling: Why AI and HPC Schedulers Hit 30% and How to Fix This

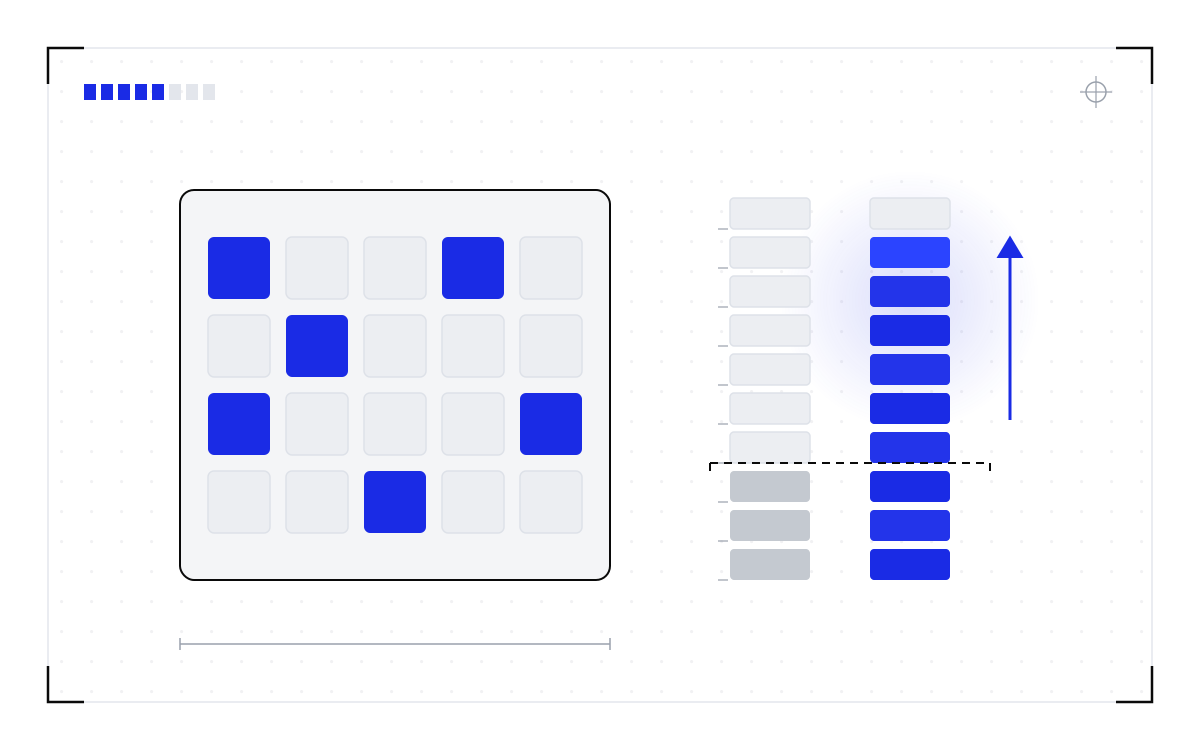
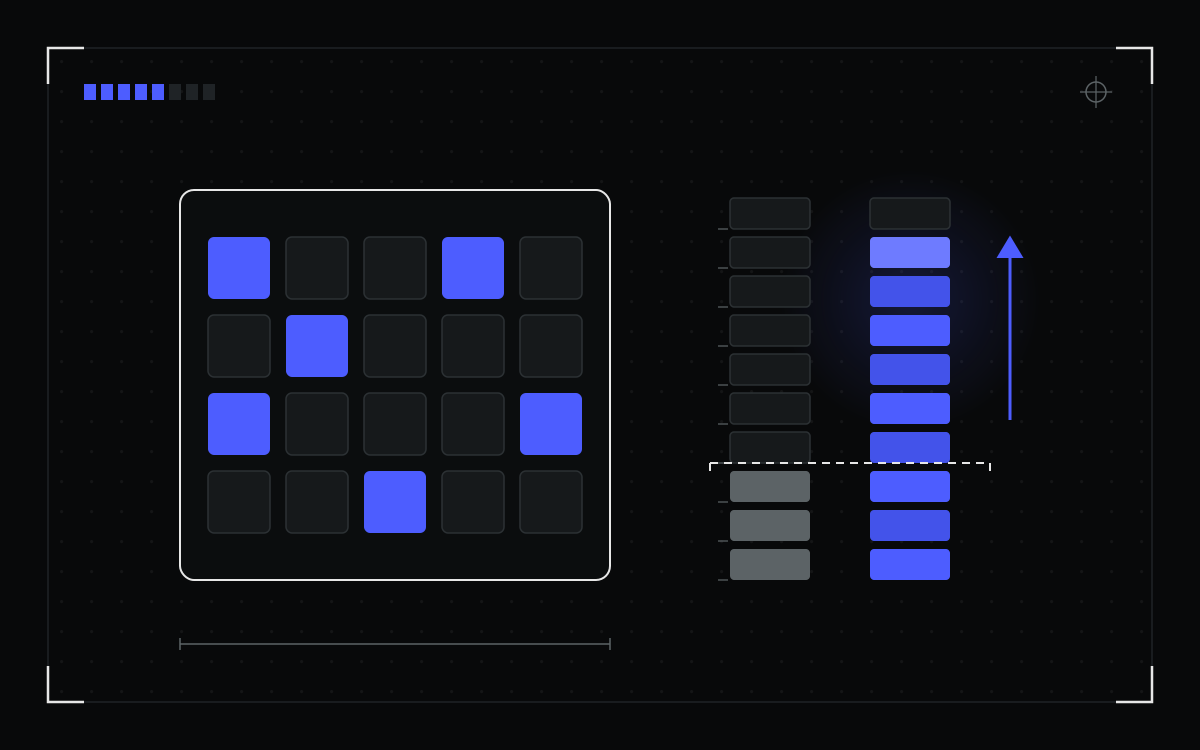
GPU utilization across AI and HPC workloads is fundamentally capped at 30% because schedulers cannot migrate running jobs. Cedana's CPU and GPU migration capability surpasses this limitation, unlocking near-full utilization.

read →
Blueprint of live migration: a dashed reclaimed spot instance, an accent state block in flight, and a healthy instance holding the restored stateBlueprint of live migration: a dashed reclaimed spot instance, an accent state block in flight, and a healthy instance holding the restored state
Updated

Using Cedana to Live-Migrate Stateful Workloads Between Spot Instances

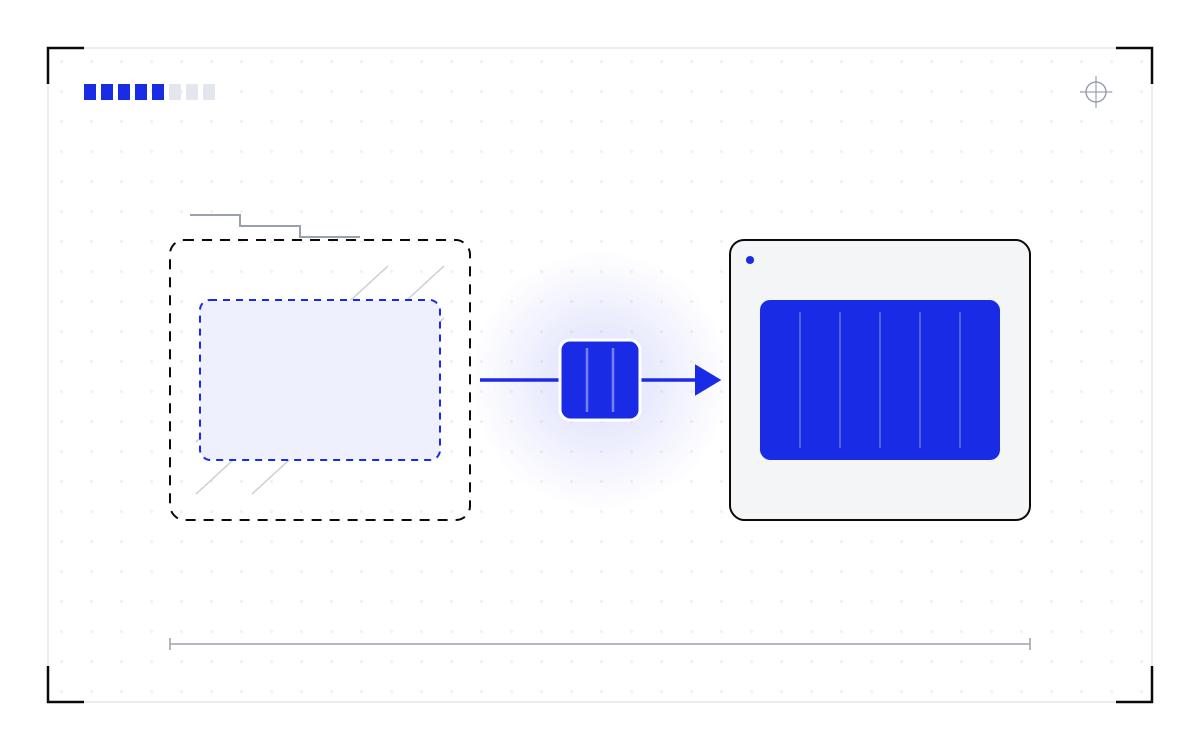
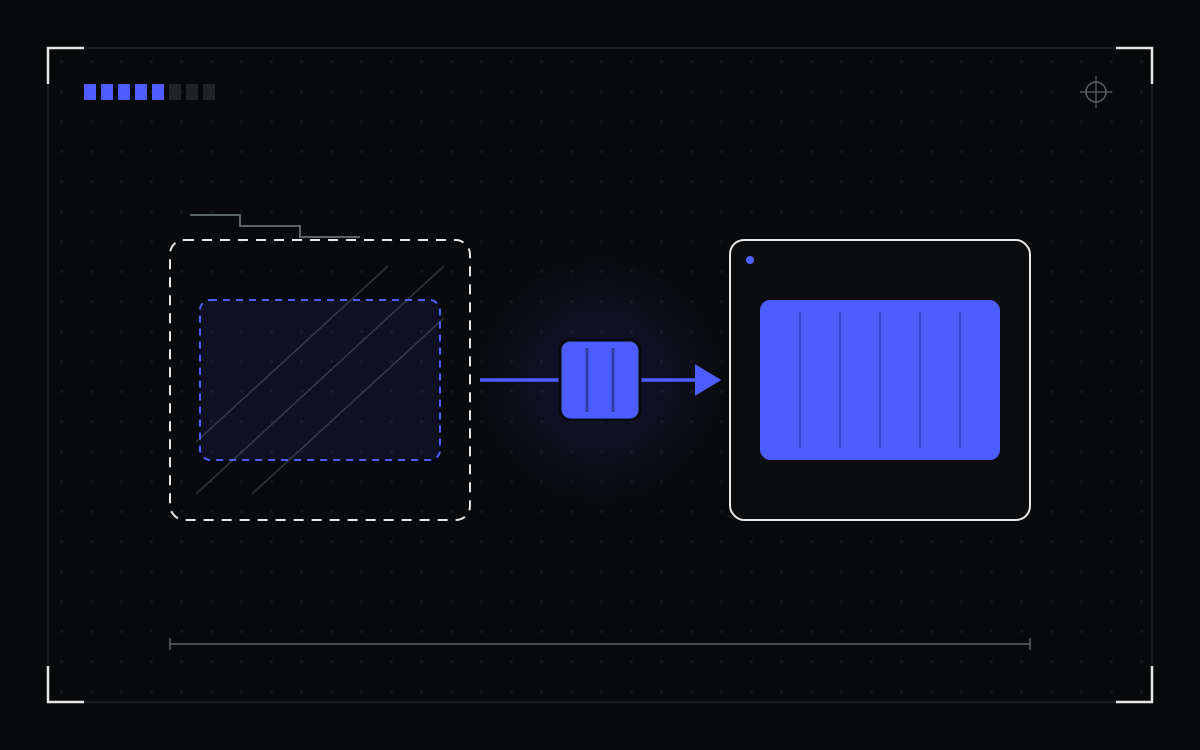
Save, migrate and resume a running XGBoost workload in six steps.

read →