

TL;DR
- A mixture-of-experts (MoE) model publishes a small activated-parameter count. That number tells you the arithmetic and not the bytes, so it is not the model's serving cost.
- Once the experts are spread across GPUs, each decode step can send tokens to whichever devices hold the experts those tokens picked. So the limit on throughput can be the network between the devices rather than the arithmetic on them.
- Adding GPUs spreads the same experts wider, so the same exchange crosses more links. None of that traffic shows up on a utilization dashboard, because a device waiting inside the exchange is reported as busy.
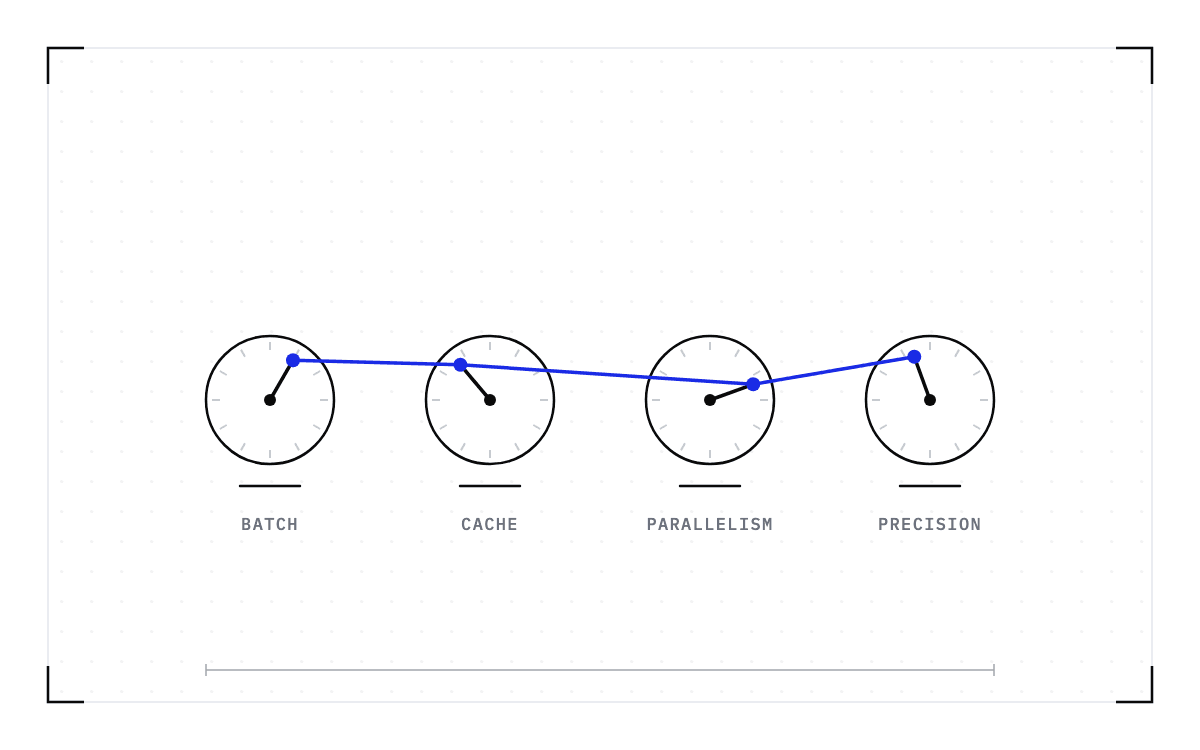
- Four readings, taken in order, tell you which of the three ceilings your deployment is under: compute utilization, then memory traffic, then the communication traces, then the end-to-end token metrics.
- In this piece we walk through why the activated count is not the serving cost, how sharding the experts adds a third ceiling above compute and memory bandwidth, and what a serving engine already does about it. Then we cover why more GPUs make it worse, and how to measure which ceiling binds.
The activated count tells you the arithmetic, and the serving cost is bytes
A mixture-of-experts model replaces the dense feed-forward block with many parallel expert blocks and a router that picks a few of them for each token. Kimi K2.6's model card records 384 experts, with 8 selected for each token, and that is how a model holding a trillion parameters activates 32 billion of them to produce one token. All the rest still have to live somewhere in the deployment.
Fewer activated parameters mean fewer floating-point operations per token, but the bytes read do not fall by the same proportion. During decode, when the model is producing tokens one at a time, the router can send one token to one set of experts and the next token to another, so a batch touches far more weights than the activated figure suggests. Set against a dense model of the same total size, a mixture-of-experts model cuts the arithmetic far more than it cuts the bytes, so every byte it reads carries less work.
Fewer operations per token makes decode harder to feed
The roofline is the standard way to say which of a machine's two limits is holding a workload back. Arithmetic intensity is the ratio of the floating-point operations a piece of work performs to the bytes of data movement required to support them. Given that ratio, the machine's peak performance and its peak bandwidth, the roofline bounds the arithmetic performance the machine can reach, and the point where the two ceilings cross is the ridge point, which NERSC calls the machine balance point.
Below the ridge point, a workload is bandwidth bound, which means its speed is set by how fast data moves through the memory system rather than how fast the calculations run on the GPU. Buying compute there changes nothing, because the device already has arithmetic capacity it cannot keep fed.
Decode on a large model sits on that side of the ridge, and selecting a few experts per token reduces the operation count more than it reduces the byte count. So a mixture-of-experts model pushes decode further left on the roofline, deeper into the bandwidth-bound regime the phase already lives in. That direction follows from the definition and is not a measurement of any particular deployment.
Everything here describes the steady state, meaning the model is resident in GPU memory and the deployment is serving traffic. Start-up time and failure recovery are different problems with different fixes.
Sharding the experts adds a ceiling one device cannot show you
A model too large for one GPU has its experts spread across several devices, and once they are spread, a token's router decision can point at an expert that lives somewhere else. Each decode step can then trigger an all-to-all exchange, in which every device sends the tokens it holds to whichever devices hold the experts those tokens picked, then waits for the results to come back.
During the part of that exchange that is not hidden behind other work, the participating devices have nothing to do. So your deployment can be network bound, with NVLink or InfiniBand saturated, while compute units and HBM (high-bandwidth memory) sit idle waiting for tokens to finish their round trip. No per-device counter names the interconnect as the reason, and a single-GPU profile never shows this ceiling at all, because on one device there is no exchange to measure.
The interconnect is a finite, shared resource with a published bandwidth limit. NVIDIA describes the GB200 NVL72 as a 72-GPU NVLink domain that acts as a single, massive GPU, and the specification gives that domain 130 TB/s of NVLink bandwidth. Devices bound into one domain wait together, so a device stalled in an exchange holds the rest of the group with it. That is our reading of the architecture rather than something NVIDIA states.
Your deployment sits under all three ceilings at the same time, and which one binds is a measurement rather than an assumption.
| Ceiling | What sets it | What the dashboard shows | What more GPUs do about it |
|---|---|---|---|
| Compute | How fast a device performs floating-point arithmetic | Compute utilization near peak, with tokens per second rising alongside it | Add capacity that pays off, if compute was the binding ceiling |
| Memory bandwidth | How fast weights and cache move between memory and the compute units | The device reported busy, its arithmetic units under-used, tokens per second flat | Nothing for the bytes each device still has to stream |
| Interconnect | How fast bytes cross the links between devices | Every device reported busy, step time long, no per-device counter naming a cause | Spread the same experts wider, so each step crosses more links |
The serving engine hides part of the exchange without raising the ceiling
A serving engine's first answer to the exchange is placement, giving attention and the feed-forward experts different parallelism, because attention likes data parallelism and experts like expert parallelism. The SGLang cookbook's per-model recipes split the two on that reasoning, and the split decides which devices have to talk to which, and how often.
The second answer is overlap, because an all-to-all is communication and communication can be hidden behind computation. While one layer's tokens are in flight across the network, the device works on arithmetic it already holds, so a good mixture-of-experts backend is mostly a scheduler for hiding the network behind the compute.
When the exchange is larger than the arithmetic available to hide it, the remainder is exposed and the pipeline waits on it. Placement decides how much exchange there is to hide in the first place. Neither move raises the interconnect ceiling.
Adding GPUs sends the same exchange across more links
If you spread the same experts across more devices, each decode step's exchange crosses more links. The token count and the expert count stay the same, but the exchange has to reach farther, so if the interconnect was already the binding resource, the extra devices add traffic. The device count and the bill rise together, but the tokens-per-second figure does not move. That is a consequence of the shape of the deployment, and nothing here says how much worse it gets on a given fleet. Domain size raises the cost of a stall as well, because a larger domain means more devices waiting on the one that is stalled.
None of that traffic announces itself on a utilization dashboard, because a collective exchange keeps every participating device occupied without any of them doing arithmetic, and a device-level counter reports the device as occupied. A fleet could in theory show 90% GPU utilization and have effective job throughput of zero. That figure is an illustration rather than a measurement. So high utilization is not evidence of delivered work.
Four readings tell you which ceiling binds
Each reading rules out a ceiling before the next one is worth taking, so take them in this order.
- Read compute utilization on the devices serving decode. If it is well below peak, the compute ceiling is not what binds, and more compute changes nothing.
- Read HBM traffic against the device's published peak bandwidth. If the memory system is near that ceiling, the workload is bandwidth bound, and the lever is fewer bytes per token.
- Read the communication traces for the collective exchanges. Time spent inside an all-to-all with the compute units quiet is the interconnect ceiling, and no per-device counter will name it for you.
- Read the end-to-end token metrics, tokens per second and time per output token, against the step time. High compute utilization, a memory system below its ceiling, and flat tokens per second mean the time is going somewhere neither counter can see.
If neither the compute units nor the memory system is near its ceiling and the step time is long, the time is most likely in the exchange between devices, and the communication traces from the third reading are what confirm it. When the exchange is what binds, added silicon does not shorten it.
Before you move anything, separate a stalled all-to-all exchange from load imbalance across replicas, because both show up as uneven utilization on a dashboard and only the communication traces tell them apart. Load imbalance is the ordinary case, because decode instances that started balanced drift apart, and only moving live work rebalances them.
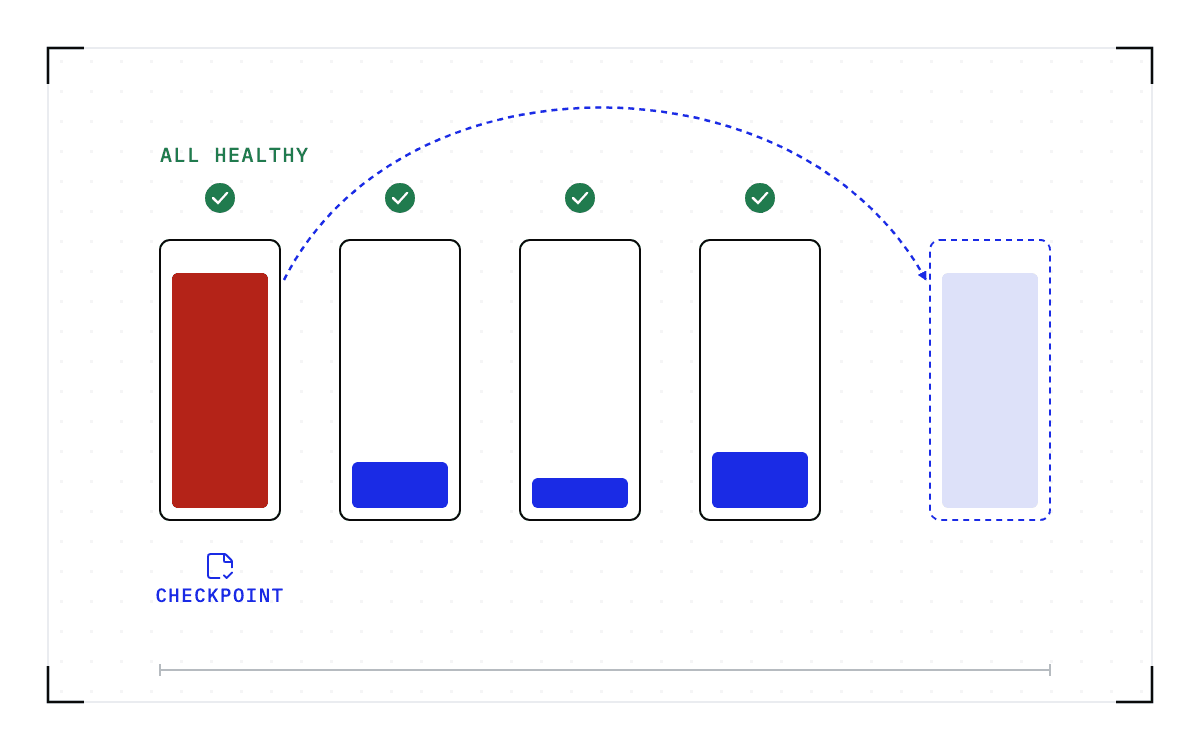
Moving live work is expensive today. A decode replica holds session state that lives only in GPU memory, and any interruption destroys it, so the only way to get it back is to run the work again.
Restarting replicas to rebalance them throws away everything those replicas were holding, so a rebalance costs you the sessions in flight unless the state moves with the work. Cedana is automated GPU checkpointing and migration infrastructure that increases the useful work your GPUs deliver. In this case, that means we save the full state of a running workload, including the cache holding the sessions in flight, and bring it back on other hardware, so a rebalance does not cost the work in progress. That does not widen the interconnect. What it changes is what it costs you to move work once your own measurements tell you where it should go.