

cedana / blog · field reports & engineering deep-dives

Writing from the
cedana team.
Engineering notes, benchmarks, and field reports covering how we build the automation layer for AI factories.
Featured
All posts · 98

insights from the team.

Field reports, engineering deep-dives, and benchmarks from the Cedana team.
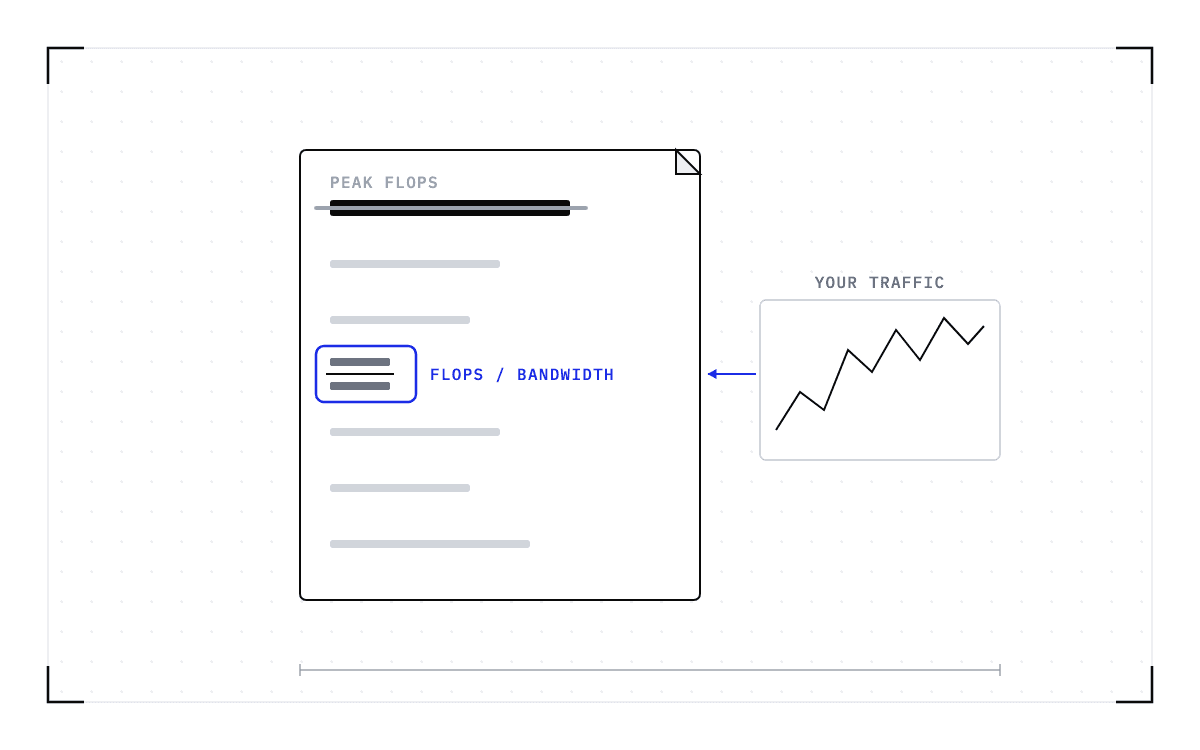
Cedana. Blueprint of a document with a folded corner and seven rows. The top row is a heavy black bar struck through by a grey line. The fourth row is a small fraction, two short bars with a line between them, ringed in blue. To the right a small framed chart with a jagged rising line sends a blue arrow toward the ringed row.
· Cedana Editorial

How to choose a GPU for LLM inference

Build an inference GPU shortlist using your traffic, memory needs, precision, latency, interconnect and rack cost, then measure startup and recovery on your path.

read →
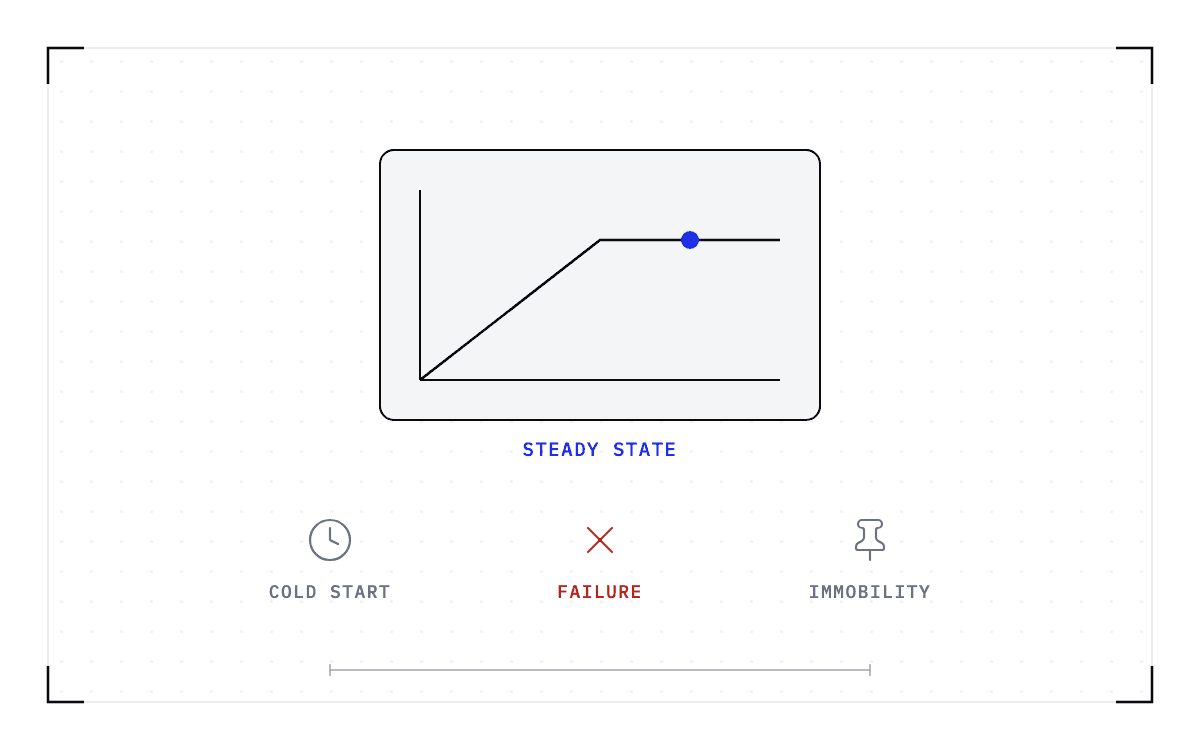
Cedana. Blueprint of a rounded panel holding a small chart, a line that rises and then runs flat with one blue dot on the flat part, marked steady state. In a row beneath the panel, three icons with their names: a grey clock marked cold start, a red cross marked failure, and a grey pin marked immobility.
· Cedana Editorial

What roofline analysis cannot see: the costs outside the steady state

Add startup, recovery and movement time to your inference measurements. Understand what steady-state roofline analysis explains and which fleet costs sit outside it.

read →
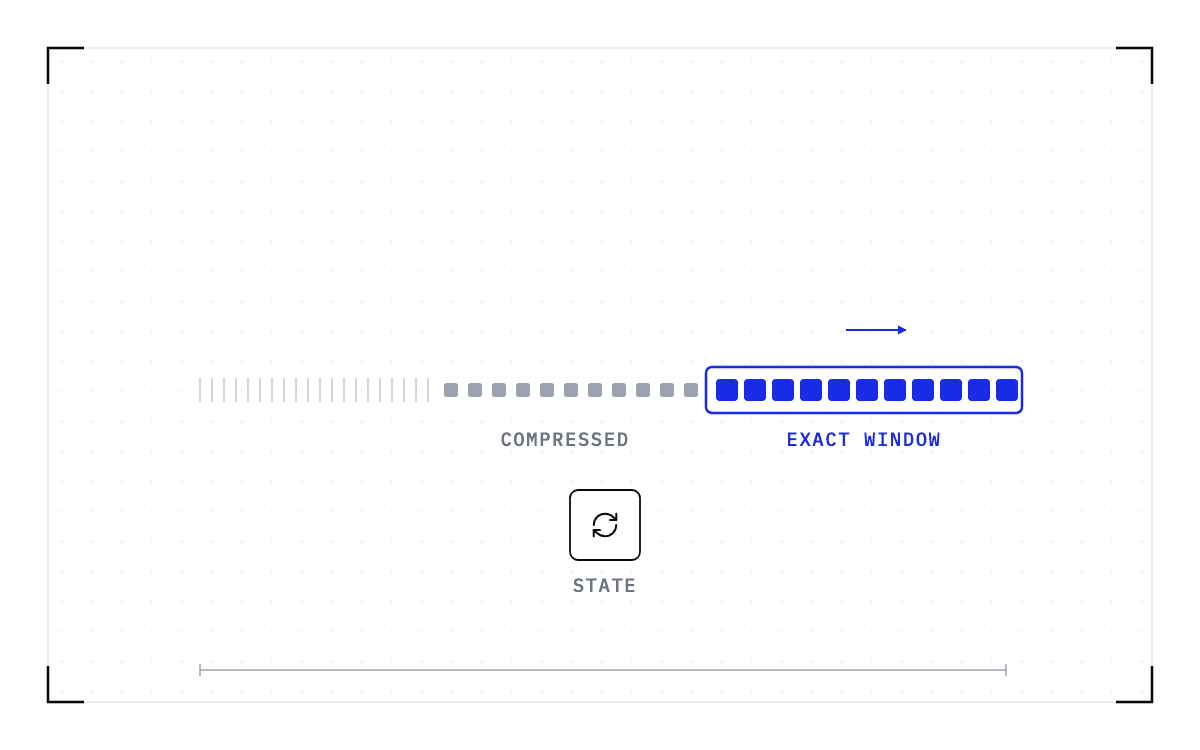
Cedana. Blueprint of one long row. On the left are faint grey ticks, in the middle small pale-grey squares, and on the right larger solid blue squares enclosed in a blue rounded frame with a small blue arrow above it pointing right. Below the frame sits a small outlined box containing a circular arrow.
· Cedana Editorial

Sliding windows, state space, and the cost of remembering

Examine how attention layouts bound session memory, distinguish windowing from cache compression, and identify what one published configuration can establish.

read →
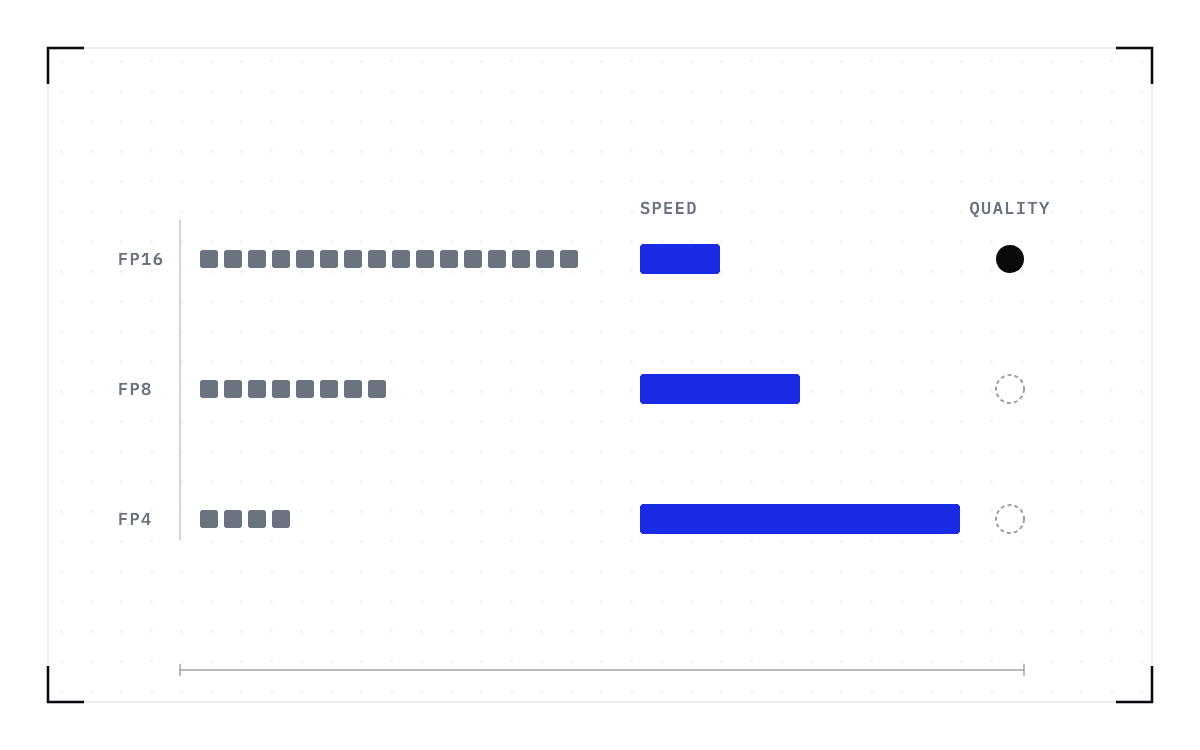
Cedana. Blueprint of three rows. The left of each row holds a run of small grey squares: sixteen, then eight, then four. Beside each run a blue bar that doubles in length row by row. At the right end of each row a circle: solid black on the first row, dashed grey outlines on the second and third.
· Cedana Editorial

The accuracy budget is part of the performance budget

Evaluate weight, KV-cache and expert-math precision changes against task quality, latency, throughput and memory on the same workload before changing production.

read →
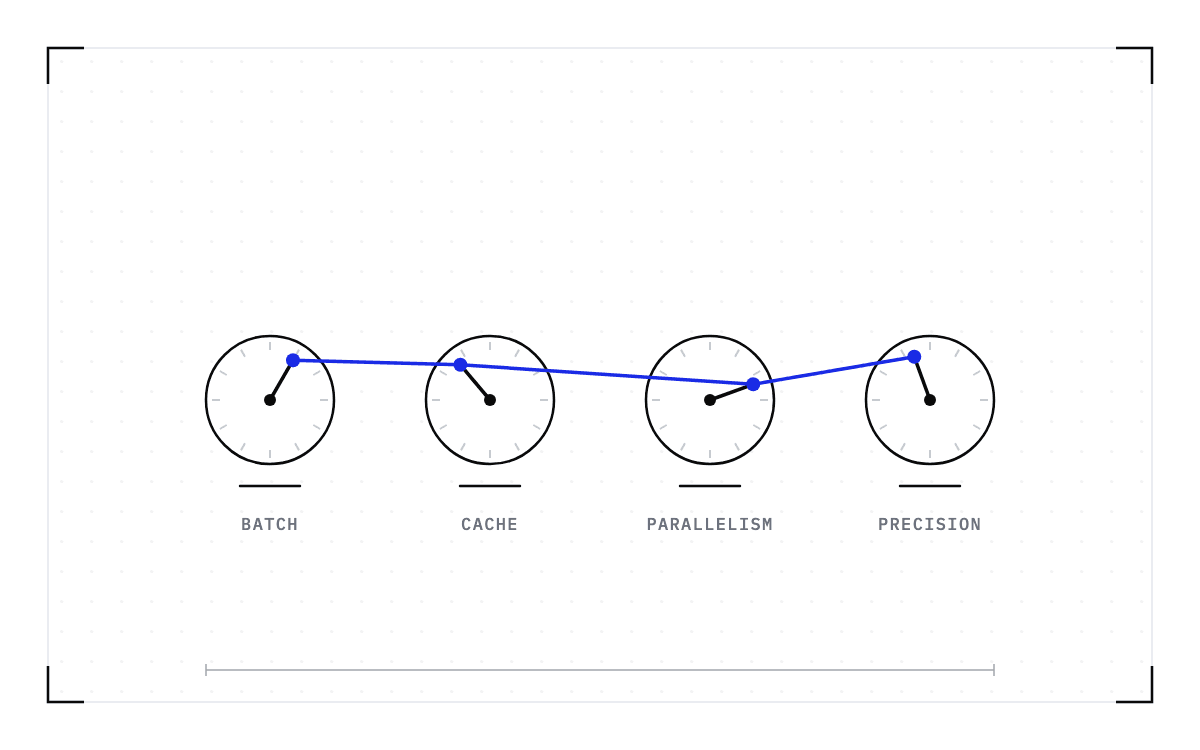
Cedana. Blueprint of four round dials in a row, each with tick marks, a centre pin and a pointer at a different angle, and a short base line beneath. One blue rod runs through the tips of all four pointers, with a blue dot at each tip, so the pointers are linked.
· Cedana Editorial

What an SGLang serve command commits your deployment to

Read SGLang presets as coupled choices about latency, throughput, memory and parallelism. Understand the tradeoffs and keep example values tied to their version.

read →
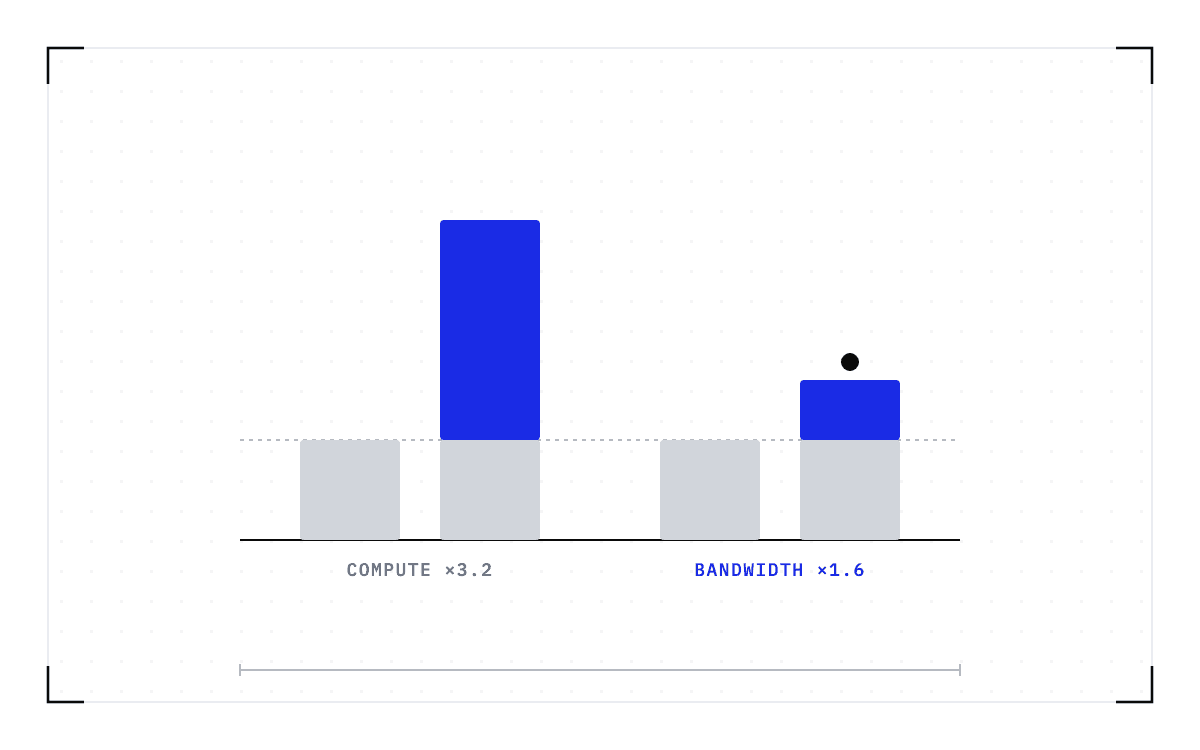
Cedana. Blueprint of two pairs of columns on a baseline with a dashed line at the height of the shorter columns. In each pair the left column is short and grey; the right column has the same grey base with a blue extension on top. The left pair's extension is tall, more than twice the base; the right pair's is small. A black dot rests above the right pair's top.
· Cedana Editorial

Why more GPU is not a performance plan

Use compute, memory bandwidth, capacity and interconnect readings to diagnose inference limits before buying more GPUs. Separate busy hardware from useful output.

read →
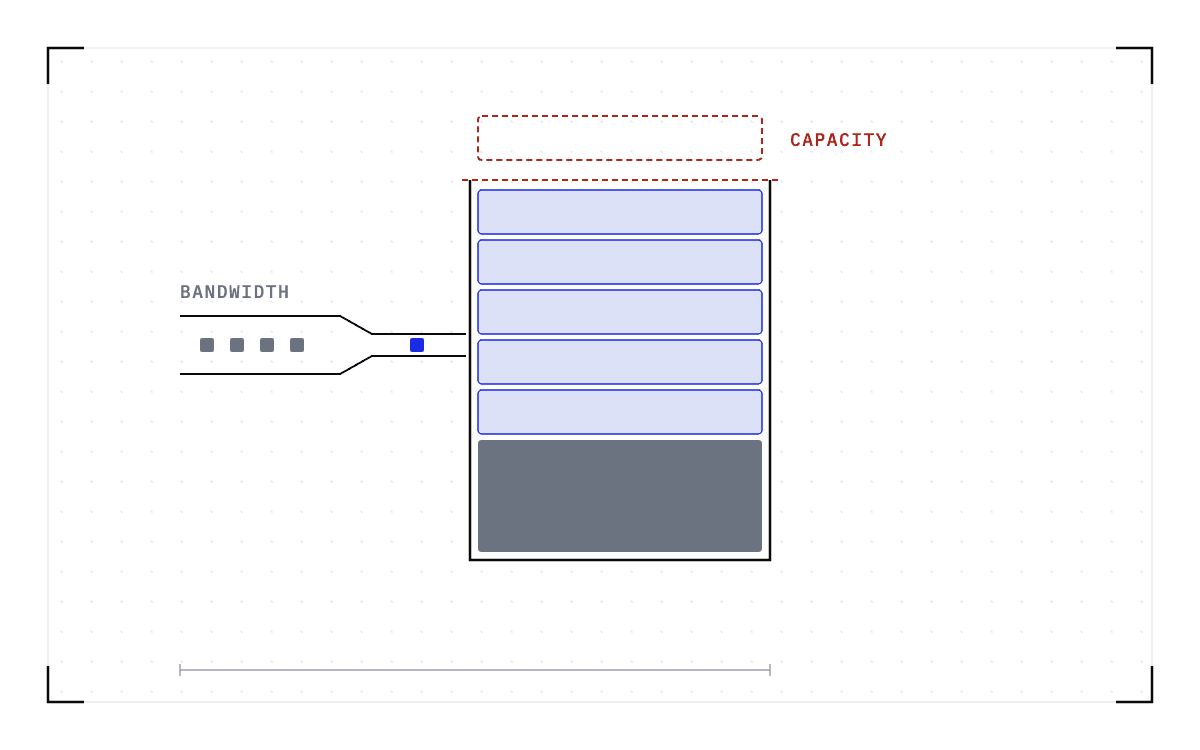
Cedana. Blueprint of a tall open-topped vessel. A dark block fills its bottom and five pale-blue slabs are stacked on it up to the brim, which is marked by a red dashed line; a sixth slab in red dashed outline floats above the opening. From the left a pipe narrows to a thin neck before it meets the vessel, with four grey squares queued in its wide part and one blue square in the neck.
· Cedana Editorial

Out of bandwidth or out of capacity: memory pressure and the quantization levers

Distinguish slow token generation from a KV cache that cannot admit more work. Match weight or cache quantization to the limit and test the resulting quality.

read →
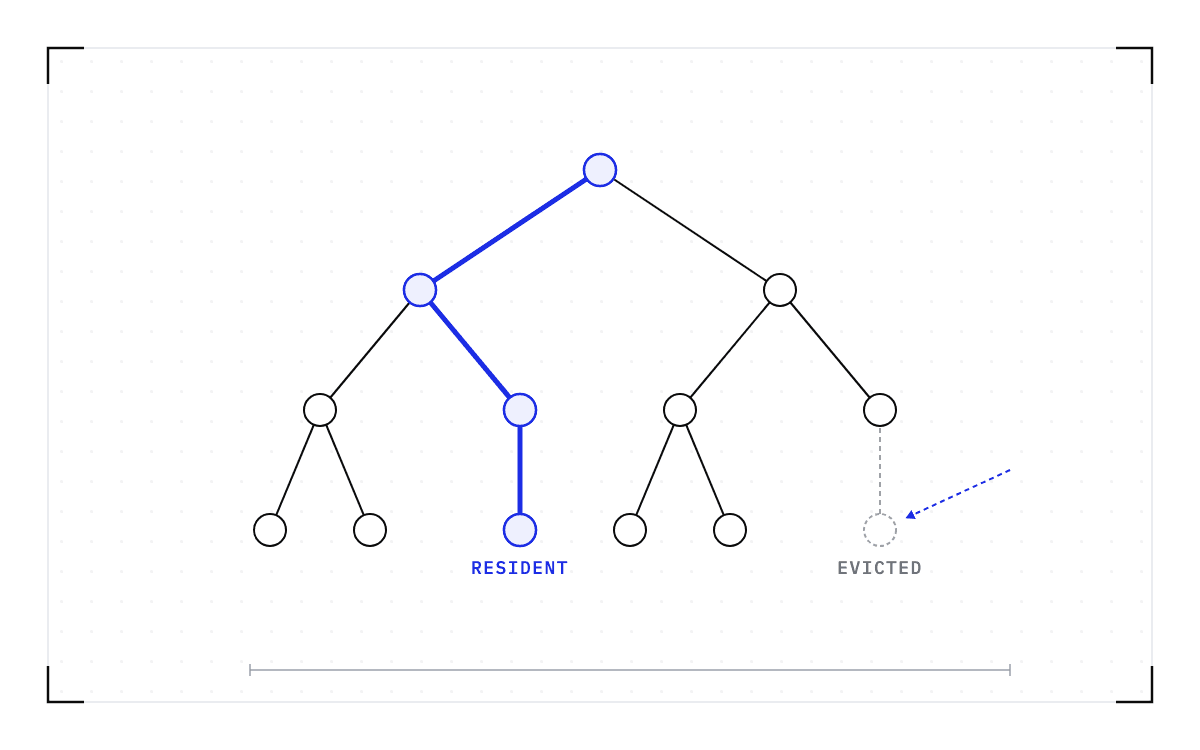
Cedana. Blueprint of a tree of small circles branching downward from one root to six leaves. One path from the root to a leaf is drawn in thick blue with blue-tinted circles. On the far right one leaf and the line to it are dashed grey, and a blue dashed arrow from outside points at that missing leaf.
· Cedana Editorial

Long context changes the economics of a fast first token

Size long-context serving around first-token latency, cache residency and concurrency. Track prefix misses and tail latency instead of relying on a median alone.

read →
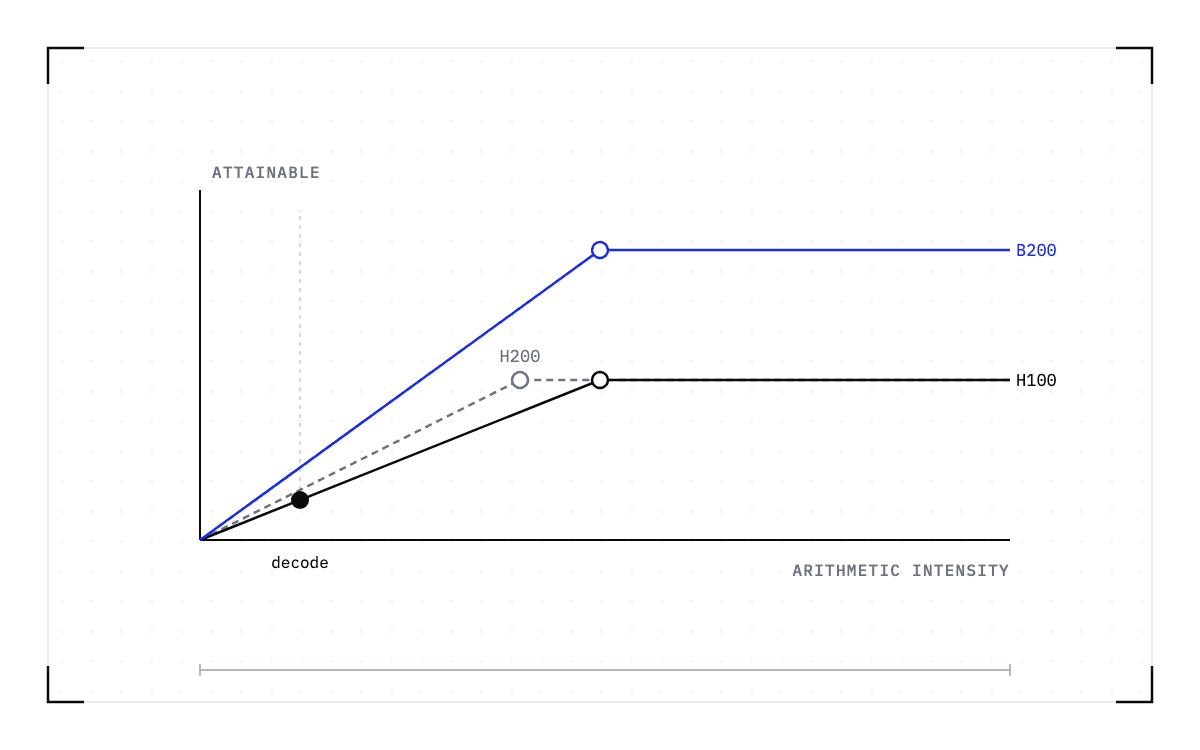
Cedana. Blueprint of a chart with two axes. Three rooflines rise from the origin and flatten: an ink one, a grey dashed one whose knee is further left at the same height, and a blue one whose knee is higher. Each knee is ringed. Far to the left, on a dashed vertical guide, a single black dot sits low on the slope.
· Cedana Editorial

The two ceilings: why the ridge point is the GPU number that matters

Calculate a GPU's ridge point from dense compute and memory bandwidth. Compare H100, H200 and B200 on a consistent basis before diagnosing your workload.

read →
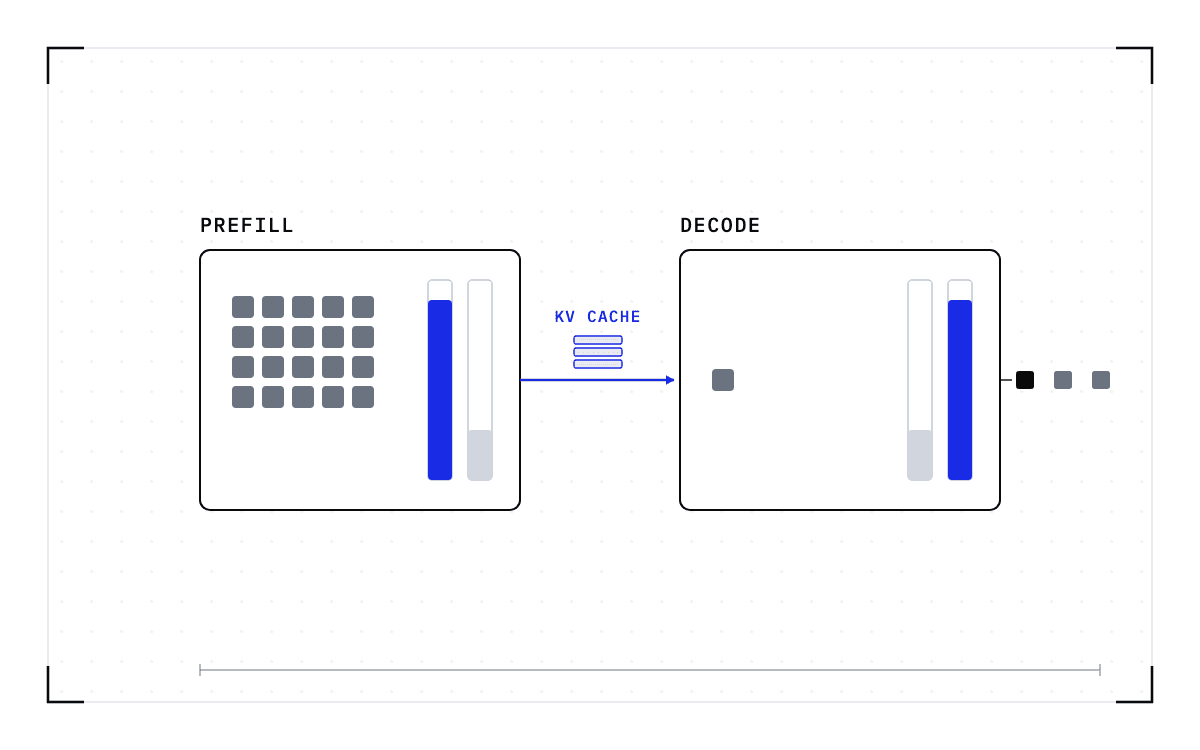
Cedana. Blueprint of two machines. The left one holds a block of twenty small grey squares and two vertical gauges, the first filled blue to the top and the second barely filled. A blue arrow carrying three thin stacked bars crosses to the right machine, which holds one small square and gauges filled the opposite way. Three single squares trail out of its right side.
· Cedana Editorial

One model, two workloads: prefill, decode, and why disaggregation exists

Understand prefill and decode resource needs, the KV-cache transfer cost of separating them, and how your traffic changes the right balance between serving pools.

read →
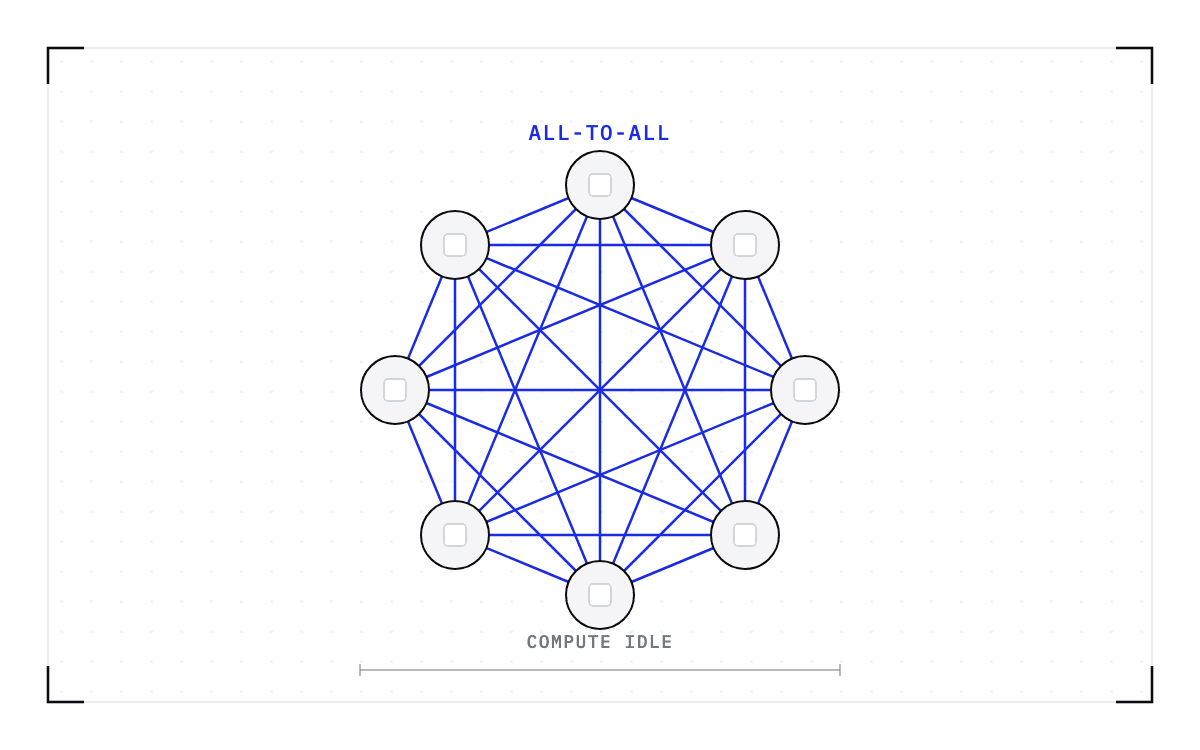
Cedana. Blueprint of eight circles arranged in a ring, each with a small empty square inside. Every circle is joined to every other by a straight blue line, so the middle of the ring is a dense blue mesh while the circles themselves are pale and empty.
· Cedana Editorial

MoE serving is a network problem, and more GPUs will not fix it

Diagnose compute, memory and interconnect limits in MoE inference. See why activated parameter counts and extra GPUs cannot replace communication measurements.

read →
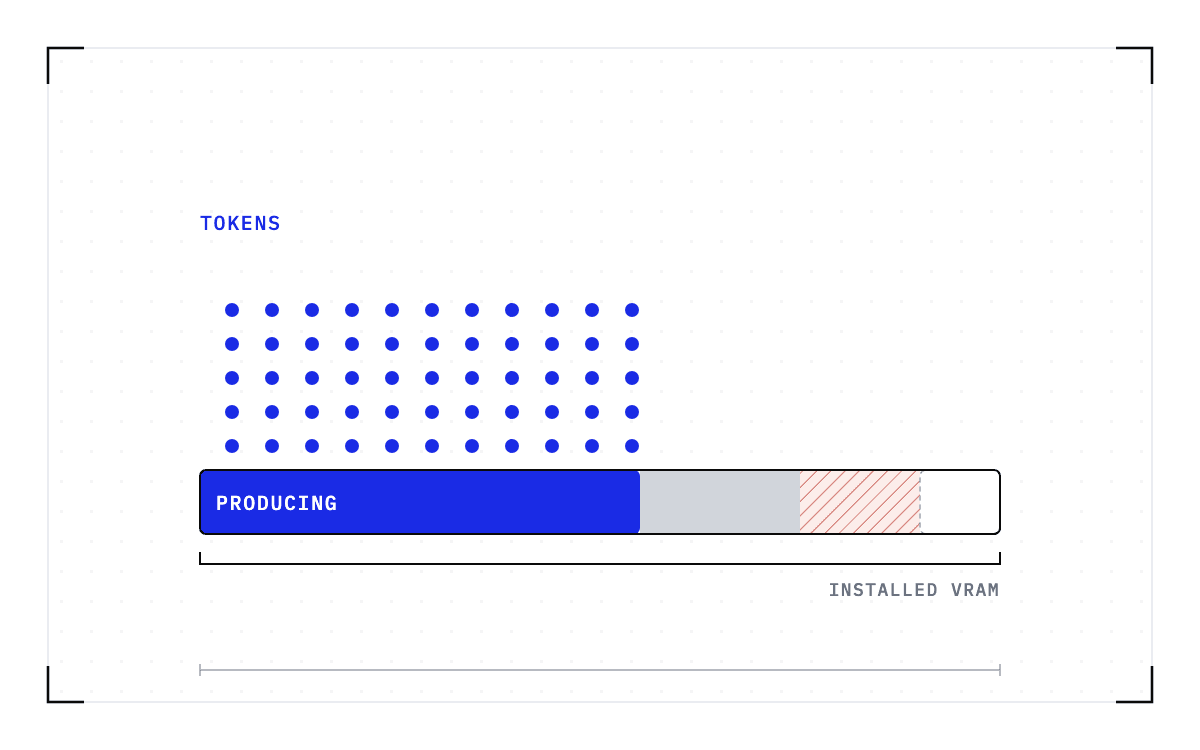
Cedana. Blueprint of one long horizontal bar under a bracket: its left half solid blue with columns of small blue dots rising above it, then a grey segment, then a red-hatched segment, then a dashed empty segment at the right, with nothing rising above any of those three.
· Cedana Editorial

The fleet's real yield metric is tokens per gigabyte of VRAM

Measure delivered tokens against installed VRAM. See how memory bandwidth, warm replicas, failures and stranded GPUs affect the output of an inference fleet.

read →

Showing 12 of 22 posts