

TL;DR
- A job stops when any one of its GPUs stops, so the GPU failure rate you have to plan for follows the number of GPUs a job spans. Meta measured a mean of 7.9 hours between failures on 1,024-GPU jobs and 47.7 days on 8-GPU jobs, on the same hardware.
- Putting more people on the on-call rotation does not change that arithmetic. A fleet of N nodes produces N times the per-node failure rate however its nodes are grouped into jobs.
- You can work out your own fleet's interval with one multiplication, nodes times your own per-node failure rate. At the intervals it gives, detection and recovery have to run without a person in the loop.
- In this piece we walk through the study behind the numbers, what Meta projects above 4,000 GPUs, and what two sources say at 100,000 GPUs. Then we cover how to run the multiplication on your own fleet, which jobs the failures land on, and why recovery cannot wait for a person.
A job stops when any one of its GPUs stops
A job spanning 1,024 GPUs ran a mean of 7.9 hours between failures, and an 8-GPU job on the same hardware ran 47.7 days, two orders of magnitude longer. The hardware is identical in both cases, so what changes is the number of GPUs the job spans. Both figures come from "Revisiting Reliability in Large-Scale Machine Learning Research Clusters", by Kokolis and colleagues at HPCA 2025, which covers 11 months on two of Meta's multi-tenant research clusters and includes 4 million jobs and over 150 million A100 GPU-hours.
In this study, a failure is any event that interrupts a job. Meta counts user programs and system software alongside hardware faults, so the 7.9-hour figure is not a hardware failure rate.
The gap between the two figures is arithmetic, not a difference in hardware quality. If node failures are independent and arrive at a steady rate per node, a job spread across N nodes fails N times as often as a job on one node, so its mean time to failure is one node's interval divided by N.
Meta's own data follows that curve: the paper reports reliability falling in inverse proportion to the GPU count, with the trend consistent from about 32 GPUs upward and less predictable below that point. The measurements come from training jobs, but the same arithmetic applies to any workload that stops when one of its GPUs stops, and a serving worker spread across several nodes is one example.
The same multiplication decides what your on-call rotation sees, because a fleet of N nodes produces N times the per-node failure rate no matter how its nodes are grouped into jobs. How you group them decides which jobs each failure interrupts and how much work is lost, not how many failures arrive.
Past 4,000 GPUs, the numbers are projections up the same curve
Observed data from these clusters stops at about 4,000 GPUs, so every figure above that point is Meta fitting a curve to its measurements and extending it upward. That curve projects 1.8 hours between failures at 16,384 GPUs and 0.23 hours, about 14 minutes, at 131,072. The last column of the table says which figures were measured and which were projected.
| GPUs in the job | Mean time to failure | Failures per day | Measured or projected |
|---|---|---|---|
| 8 | 47.7 days | one in 47.7 days | measured |
| 1,024 | 7.9 hours | about 3 | measured |
| 16,384 | 1.8 hours | 13.3 | Meta projects |
| 131,072 | 0.23 hours, about 14 minutes | about 104 | Meta projects |
At 100,000 GPUs, two different sources put the interval under half an hour
Meta's own Llama 3 training run sits near the top of that table, measured rather than projected, and on different hardware. Meta trained Llama 3 405B on up to 16,384 H100 GPUs and logged 466 job interruptions in a 54-day snapshot of pre-training, of which 419 were unexpected. That is one unexpected interruption every 3.1 hours, compared with the 1.8 hours the research-cluster curve projects at the same GPU count.
These two figures are not the same measurement: one is an H100 training cluster counting unexpected interruptions to a single run, and the other is a curve fitted to A100 research clusters that counts every interruption to every job.
Epoch AI turns the Llama 3 count into a per-GPU rate of one interruption every 50,000 hours or so, about 6 years. Scale that rate to 100,000 GPUs, and the cluster faces a failure every 30 minutes. That rate counts how often a GPU has its job interrupted, not how often the GPU itself fails, because every unexpected interruption to the run is included.
Neither Epoch's 30-minute figure nor Meta's 14-minute figure is a measurement at that scale, and the two rest on different data. Both put the interval between job interruptions at roughly a quarter of an hour to half an hour.
You can work out your own fleet's rate with one multiplication
The multiplication needs a per-node failure rate, and Meta publishes one for a whole year on one of its clusters, using a 30-day rolling average. The rate moves between about 2.5 and about 17.5 failures per 1,000 node-days, where a node-day is one node running for one day.
Take a 128-node fleet at 8 GPUs per node, which is 1,024 GPUs, and multiply the nodes by the rate. At the bottom of Meta's range, that comes to 0.32 node failures a day, or one every 3.1 days. At the top, it is 2.24 failures a day, or one every 10.7 hours.
Those figures count node failures only, and they assume the fleet is running as one 1,024-GPU job. Meta's measured 7.9-hour interval at that size counts every cause that interrupts a job, which is why it is shorter than either interval from node failures alone.
To run the same calculation on your own fleet, count the node failures over a month, divide by the node-days in that month, and multiply by the number of nodes a job spans.
The failures land on the jobs holding the most runtime
Most jobs on Meta's clusters never fail: infrastructure failures affect 0.2% of jobs, and those failures interrupt 18.7% of runtime.
A long job is exposed for longer, and a large job spans more GPUs. So the failures collect on the jobs holding the most work, and those are the jobs that lose the most when they stop.
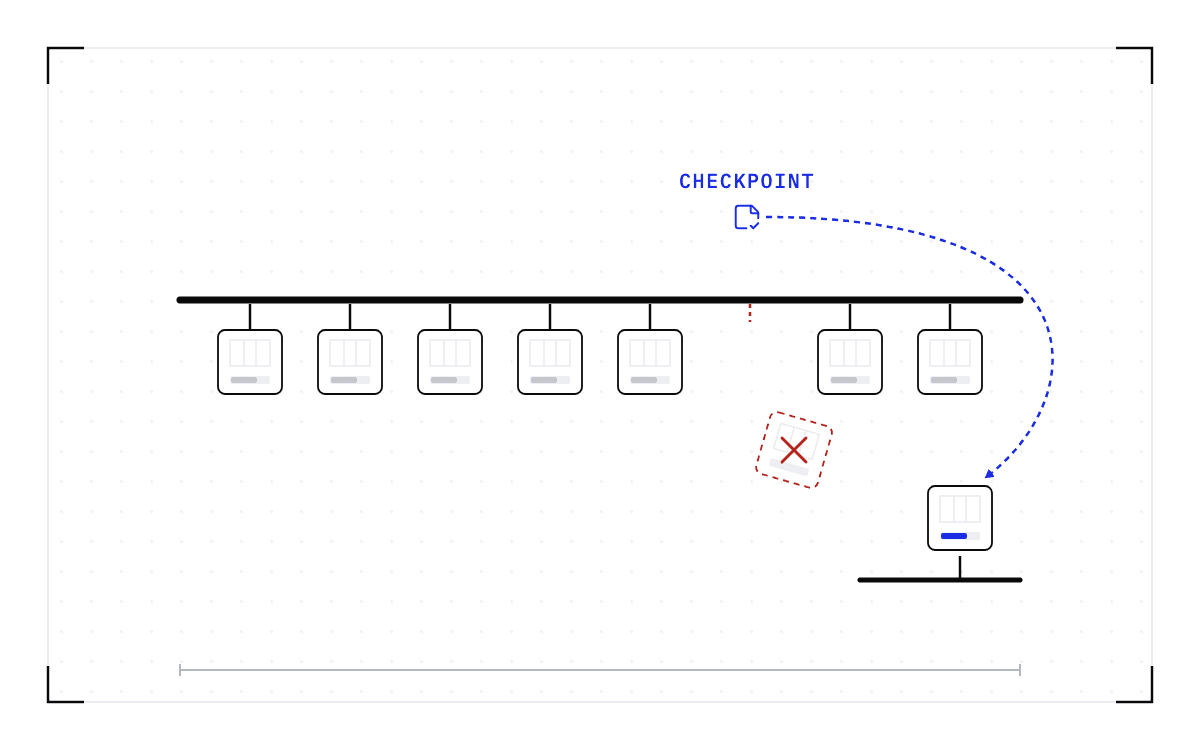
On a serving fleet, the job holding the most work is a worker spread across several nodes, and every session it was holding dies with the node. On a research cluster it is the week-long simulation in a single allocation, where a failure on day 6 costs everything run since the last application checkpoint.
At that rate, recovery cannot wait for a person
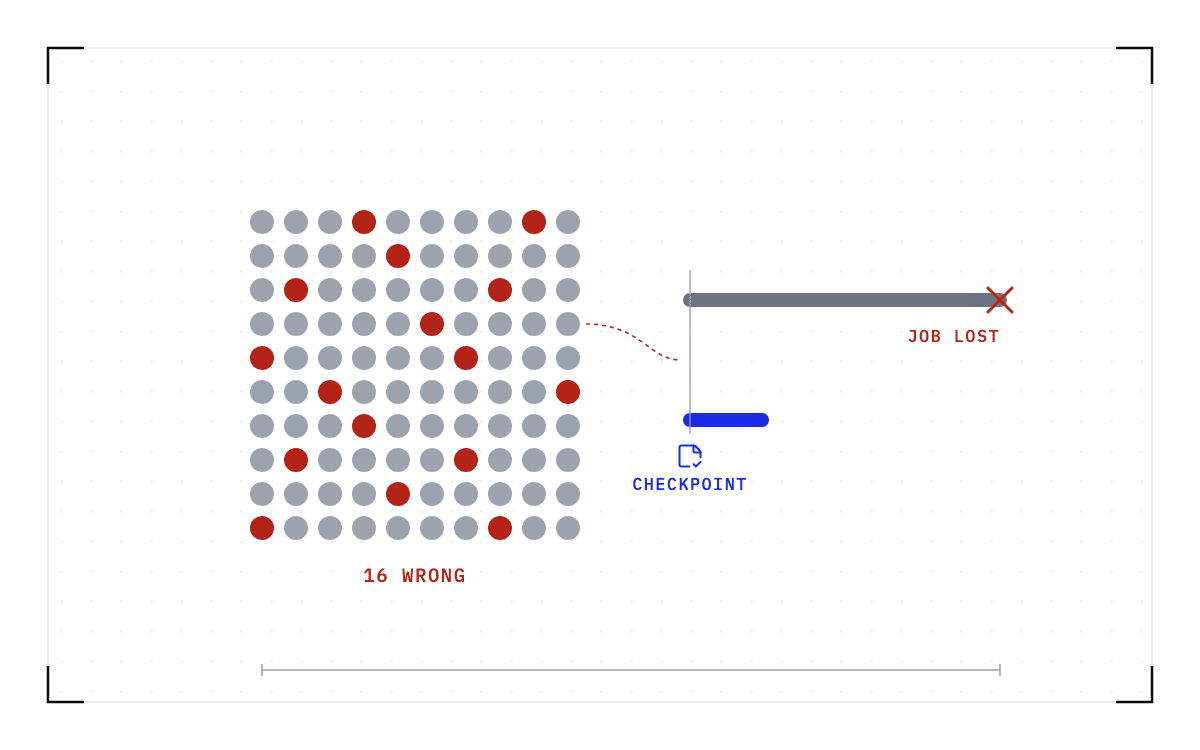
An 8-hour shift on a 1,024-GPU job sees about one failure. At 16,384 GPUs, Meta's projection puts 4 or 5 failures in those 8 hours.
Crusoe's engineering blog reaches that point from running the clusters: at large scale "failures are so frequent that manual investigation and correction is unsustainable". Meta draws the same conclusion from its own projections and states that "we must accelerate the process of failure detection and recovery".
The Llama 3 run shows what automated recovery looks like at that rate: across the 419 unexpected interruptions, significant manual intervention was needed three times, and automation handled the rest. The run maintained more than 90% effective training time.
Meta automated detection as well, and excluding the nodes its detector flagged cut failures among jobs of 512 GPUs or more from 14% to 4%. That lowers the rate without removing it, so recovery has to handle what remains, and with a checkpoint in place what remains costs the resume time rather than the work.
The rate your own multiplication gives you is the rate the recovery has to keep up with, so the detection and the restore both have to run without a person in the loop, and that is the path we automate at Cedana. Cedana is automated GPU checkpointing and migration infrastructure that increases the useful work your GPUs deliver. In practice, that means a background worker takes the checkpoints and runs the restore when your policy calls for it, without an administrator present. So the number of failures your fleet produces in a day does not have to be matched by the number of people on call.
Related:
- What happens to a training job when a GPU fails
- One node failed and the whole training job died
- What torchrun, torchft and Ray Train restart from when a node dies
- What to do when vLLM or SGLang stops responding and nothing crashed
Common questions
How does the failure rate scale with the size of the job?
A job stops when any one of its GPUs stops, so a job spread across N nodes fails N times as often as a job on one node, and its mean time to failure is one node's interval divided by N. Meta's data follows that rule from about 32 GPUs upward, and the same arithmetic applies to any workload that stops when one of its GPUs stops, including a serving worker spread across several nodes.