

cedana / blog · field reports & engineering deep-dives

Writing from the
cedana team.
Engineering notes, benchmarks, and field reports covering how we build the automation layer for AI factories.
Featured
All posts · 98

insights from the team.

Field reports, engineering deep-dives, and benchmarks from the Cedana team.
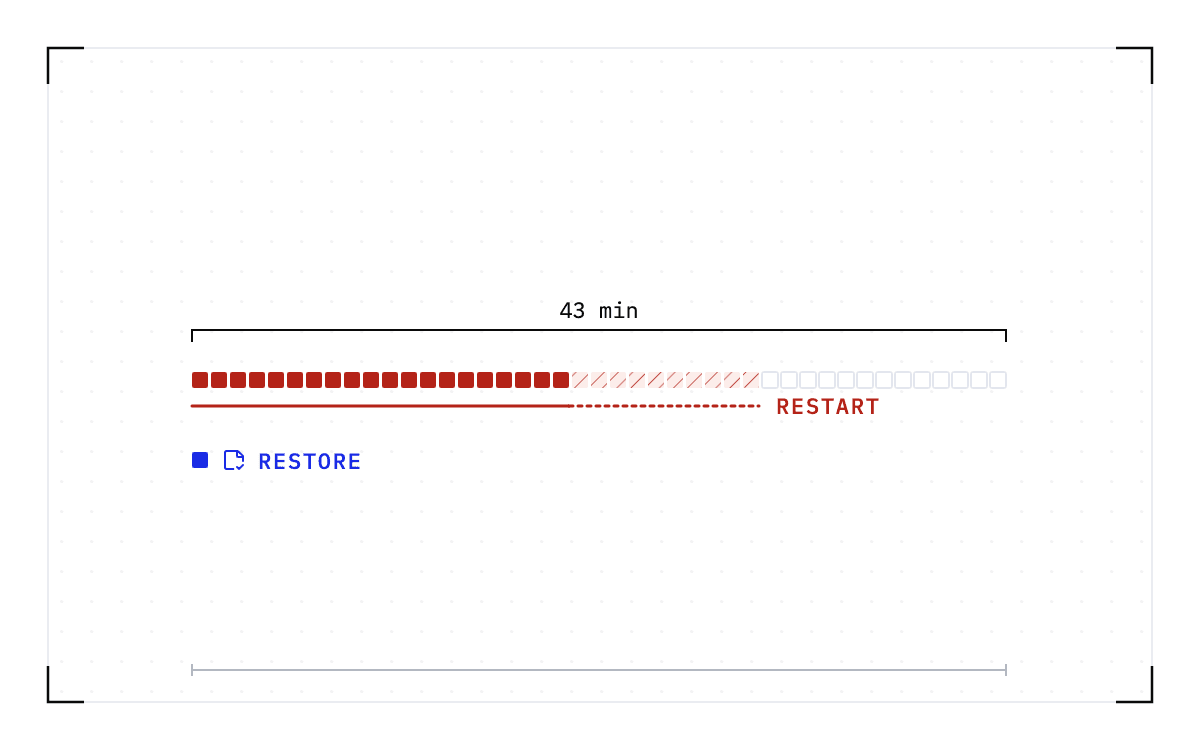
Cedana. Blueprint of a row of forty-three small squares under a bracket that spans them all: the first twenty solid red, the next ten red-hatched, the rest empty outlines. Below the row a red line runs under the twenty and continues dashed under the ten. Further down, a single blue square sits beside a saved-state icon.
· Cedana Editorial

One frontier restart burns half a monthly 99.9% error budget

Calculate how model restart time consumes an inference error budget, what replicas change, and how to compare a measured restore with your availability SLO.

read →
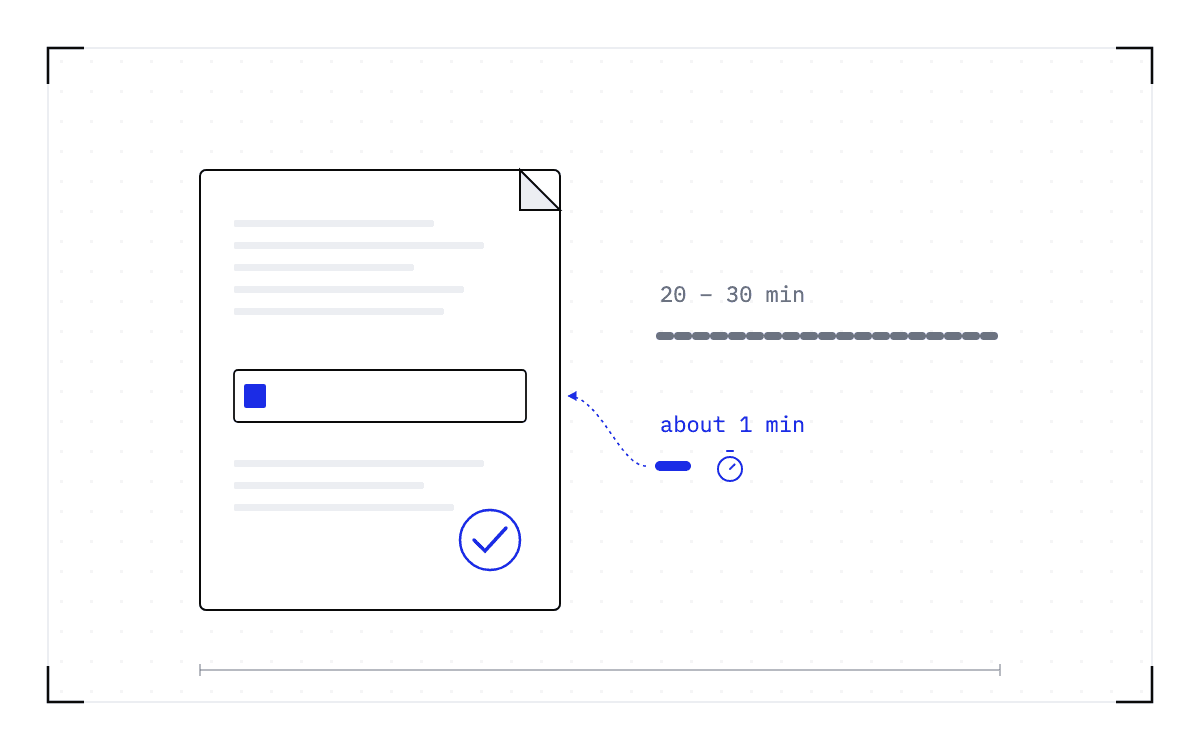
Cedana. Blueprint of a document with a folded corner, ruled lines, one boxed field holding a short blue mark, and a blue circled tick. To the right, two candidates for the field: a long grey dashed bar marked twenty to thirty minutes, and a very short blue bar beside a timer icon marked about one minute, from which a thin blue line leads back into the field.
· Cedana Editorial

The recovery time you can put in a filing

Define and test LLM recovery time from failure to serving again. Separate restore benchmarks from the detection, placement and recovery your team must document.

read →
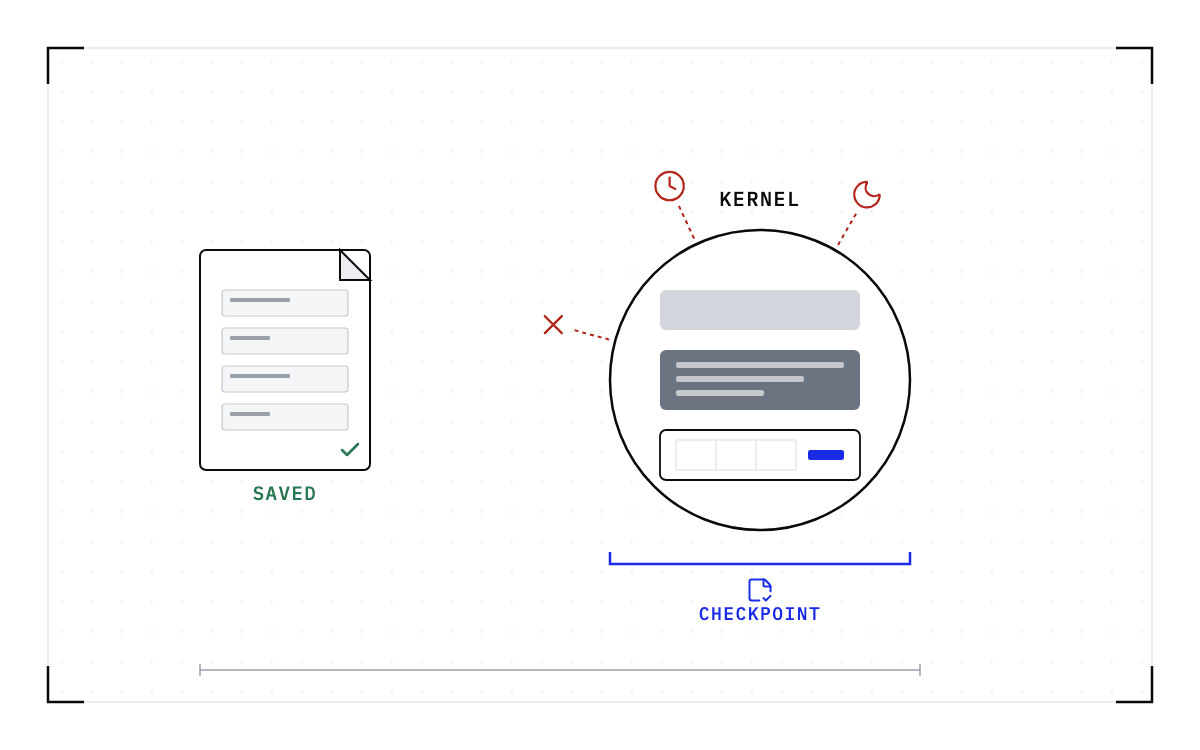
Cedana. Blueprint of a small document on the left with four code cells and a green tick, marked saved, and on the right a large circle marked kernel holding a grey band, a dark block and a GPU card. Three red icons sit around the circle, a cross, a clock and a moon, each joined to it by a red dashed line. A blue bracket spans the circle beneath it with a save icon marked checkpoint.
· Cedana Editorial

When the node dies under a Jupyter session

Learn what a notebook file cannot recover after a GPU node fails, how process checkpoints preserve kernel state, and which restoration limits still apply.

read →
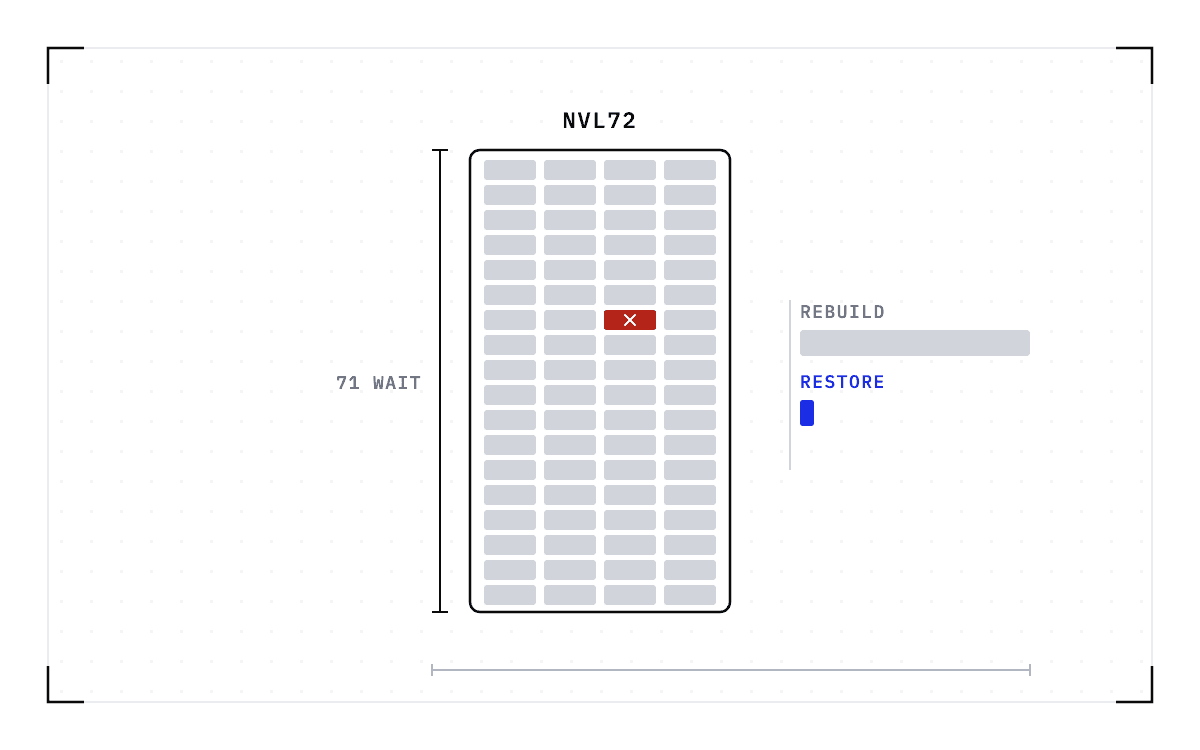
Cedana. Blueprint of a tall server rack holding eighteen trays of four grey GPU cells, with one cell in the upper middle filled red and struck out. A bracket down the rack's left side spans its full height. To the right, a long grey bar and beneath it a very short blue bar beside a saved-state icon.
· Cedana Editorial

One GPU fails and 71 healthy GPUs wait

Understand how one failure stalls a tensor-parallel NVL72 workload, how recovery consumes healthy GPU-hours, and where published measurements stop.

read →
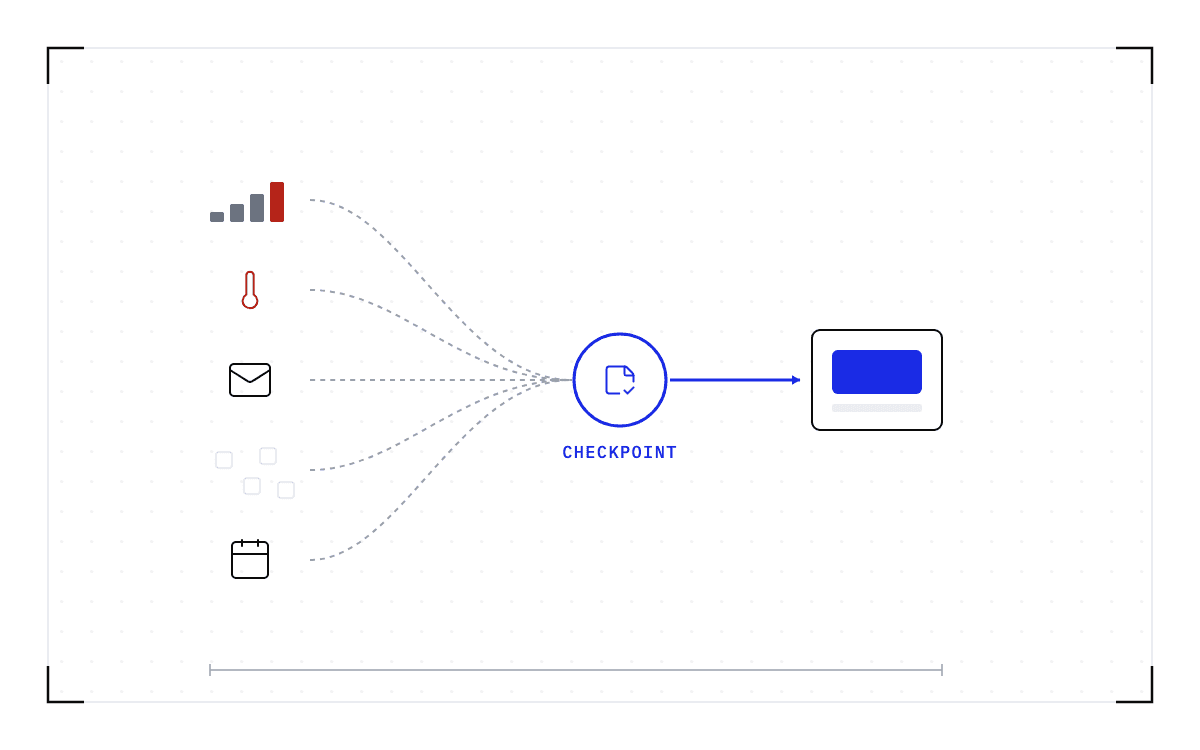
Cedana. Blueprint of five small glyphs down the left, a rising bar chart with a red top bar, a thermometer with a red column, an envelope, four scattered empty squares, and a calendar tile, each joined by a grey dashed wire to one blue ring at the centre holding a saved-state icon. From the ring one solid blue arrow leads to a node holding a blue block.
· Cedana Editorial

Five fleet signals, five policies: from alert to automatic action

Connect GPU health, thermal, reclaim, fragmentation and maintenance signals to workload-preserving actions. See which triggers ship and which remain designs.

read →
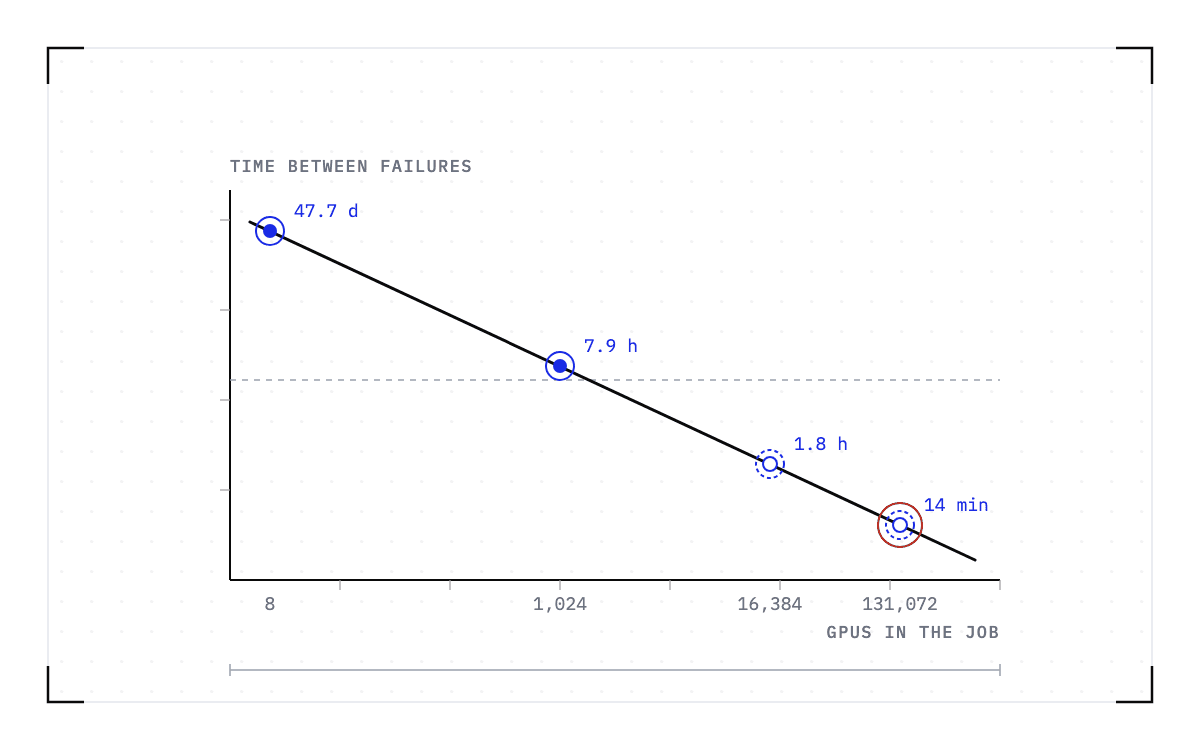
Cedana. Blueprint of a plot with a straight line falling from the upper left to the lower right across log axes. Two solid blue points sit on its upper half and two hollow dashed blue points on its lower half, the last one ringed in red near the bottom. A grey dashed horizontal line crosses the plot at the height of the second point.
· Cedana Editorial

GPU failure frequency scales with the fleet, not the on-call rotation

Use published cluster studies to understand how GPU job interruptions scale, distinguish measurements from projections, and estimate your own fleet's rate.

read →
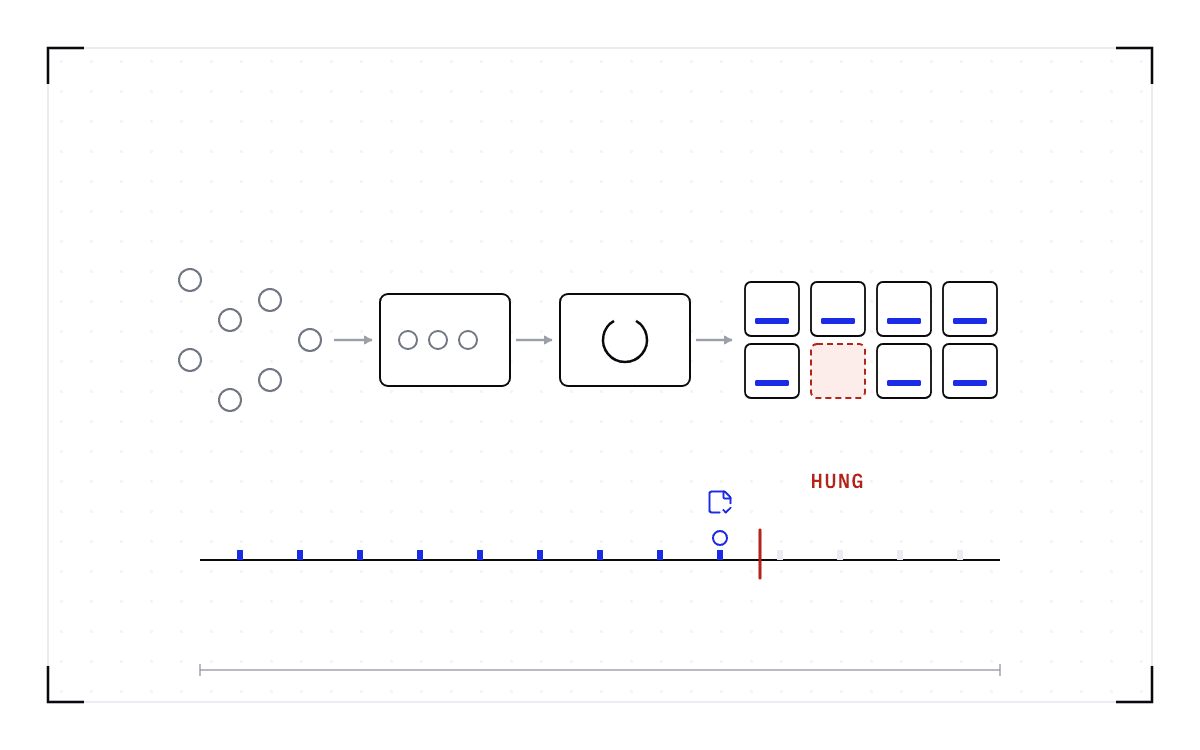
Cedana. Blueprint of a serving engine as a chain: a scatter of small request circles waiting on the left, an arrow into an API server box that already holds three, an arrow to an engine-loop box with a circular arrow inside, and an arrow to a grid of eight worker squares, seven with blue status bars and one filled pale red with a dashed red outline and no bar. Under the chain a timeline of blue heartbeat marks runs up to a red bar, the hang, with the last mark before it ringed under a saved-state icon.
· Cedana Editorial

What to do when vLLM or SGLang stops responding and nothing crashed

Separate a stalled serving engine from a hung GPU. Understand health-check limits and why recovery needs a checkpoint from before the engine stopped.

read →
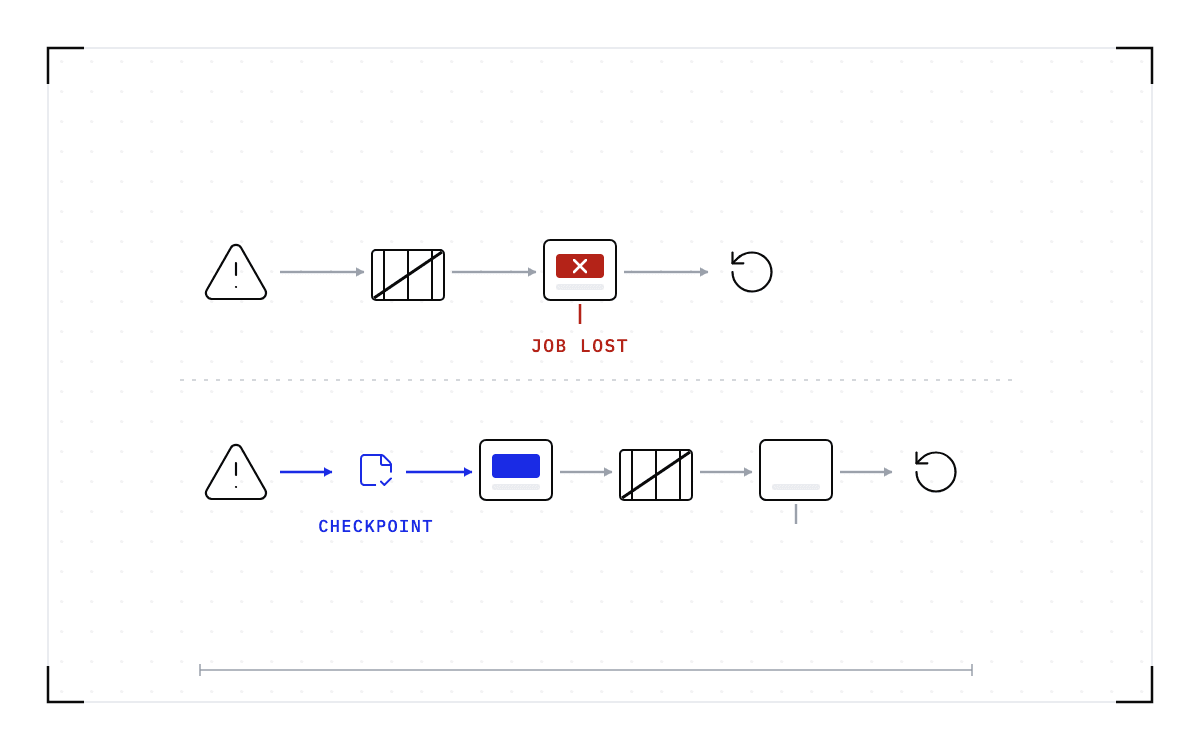
Cedana. Blueprint of two rows of the same steps in different orders. On top: a warning triangle, a cordon barrier, a node whose job is red and struck out as it drains, then a reset arrow. Below: the warning triangle, a blue saved-state icon, a healthy node holding the job in blue, then the cordon, an empty node draining, and the same reset arrow.
· Cedana Editorial

What to do when DCGM flags a GPU that has a job running on it

Interpret DCGM and Xid alerts, distinguish repair from workload recovery, and decide which checkpoint to restore before draining a degraded GPU node.

read →
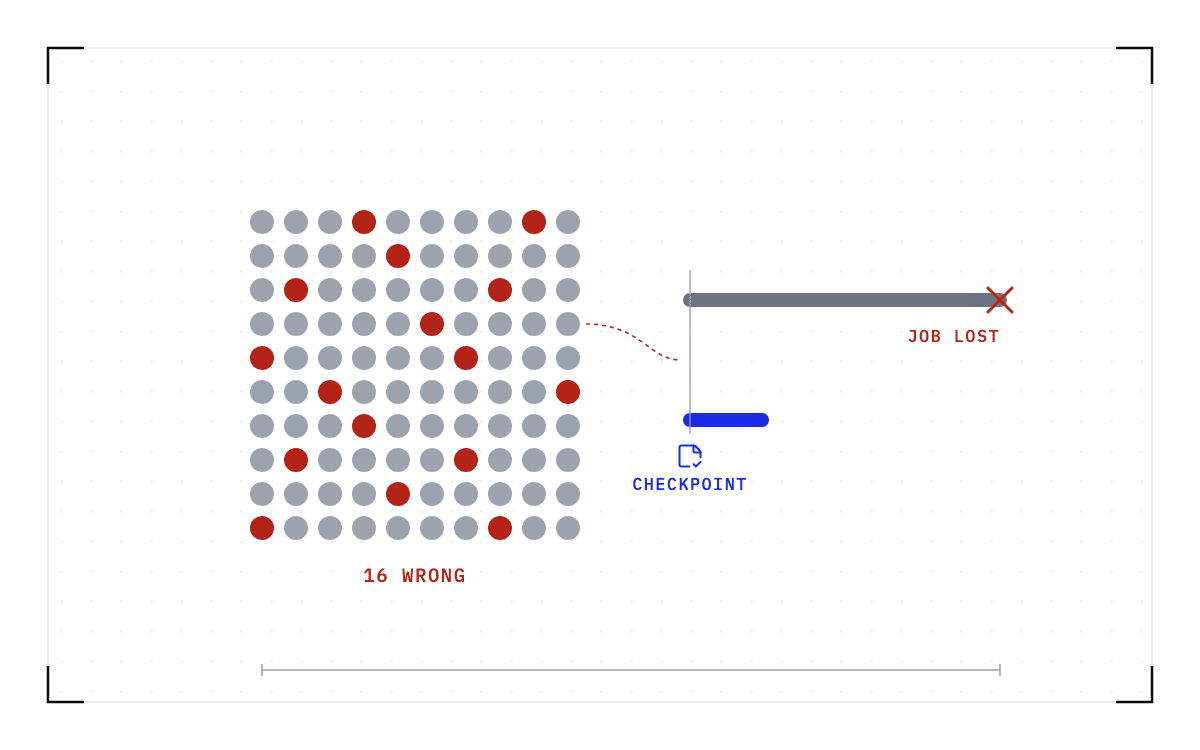
Cedana. Blueprint of a ten by ten grid of dots, eighty-four grey and sixteen red scattered among them, the wrong predictions in a hundred. To the right two thick bars from one baseline: a long grey bar ending in a red cross, what each wrong one costs today, and a short blue bar under a saved-state icon, what it costs when acting means a restore.
· Cedana Editorial

Is it worth acting on a GPU failure prediction?

Assess GPU failure predictions using precision, warning time and the cost of acting. Understand what checkpoints change and which failures give no warning.

read →
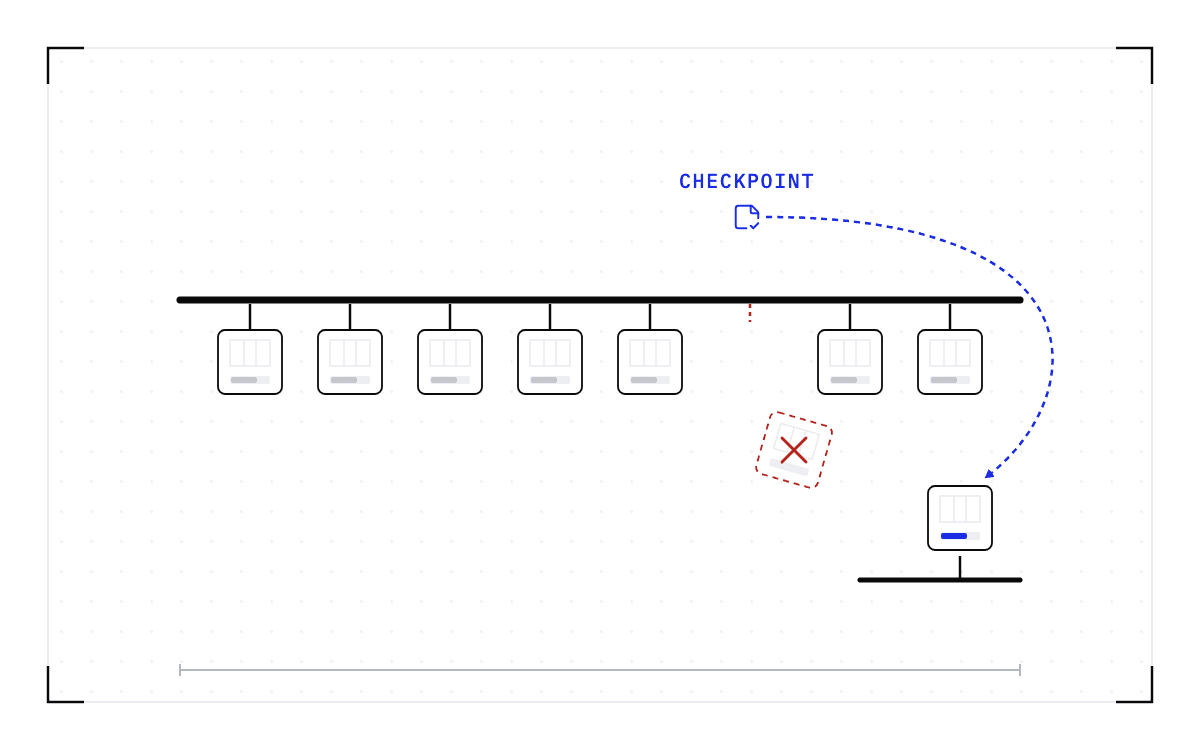
Cedana. Blueprint of a thick horizontal bus with eight GPU cards hanging from it on short stems, their status bars grey. One stem is broken into red dashes and its card has dropped away below the row, tilted, outlined in dashed red and struck out. From a saved-state icon above the bus a blue dashed arrow curves down to a ninth card on a second, shorter bus at the lower right, its status bar blue.
· Cedana Editorial

What happens to a training job when a GPU fails

Understand Xid faults, GPU resets and the state a training job loses. Learn why recovery depends on a checkpoint taken before the hardware fails.

read →
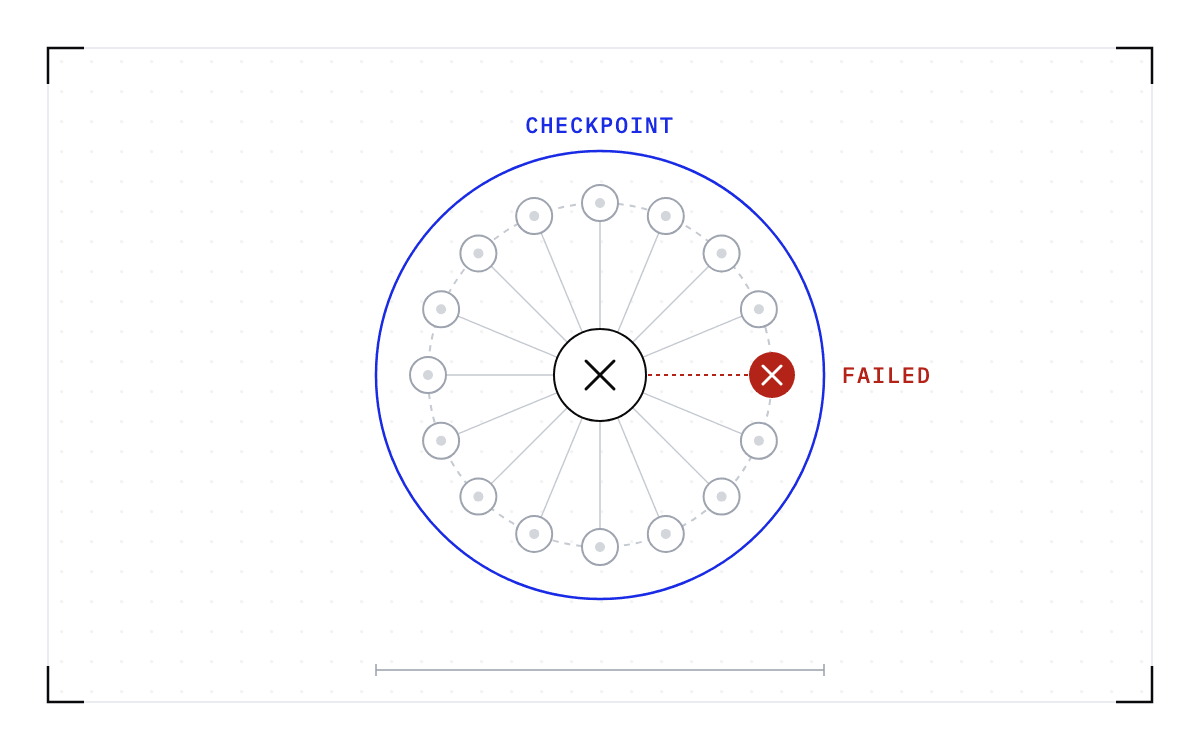
Cedana. Blueprint of sixteen GPUs in a ring as one training group, one filled red and struck out, the ring joining them broken into dashes, and the collective at the hub struck out. A blue ring encloses the whole group.
· Cedana Editorial

One node failed and the whole training job died

Learn why one failed rank stops a distributed training job, what NCCL timeouts mean, and how checkpoint state determines what a restart can recover.

read →
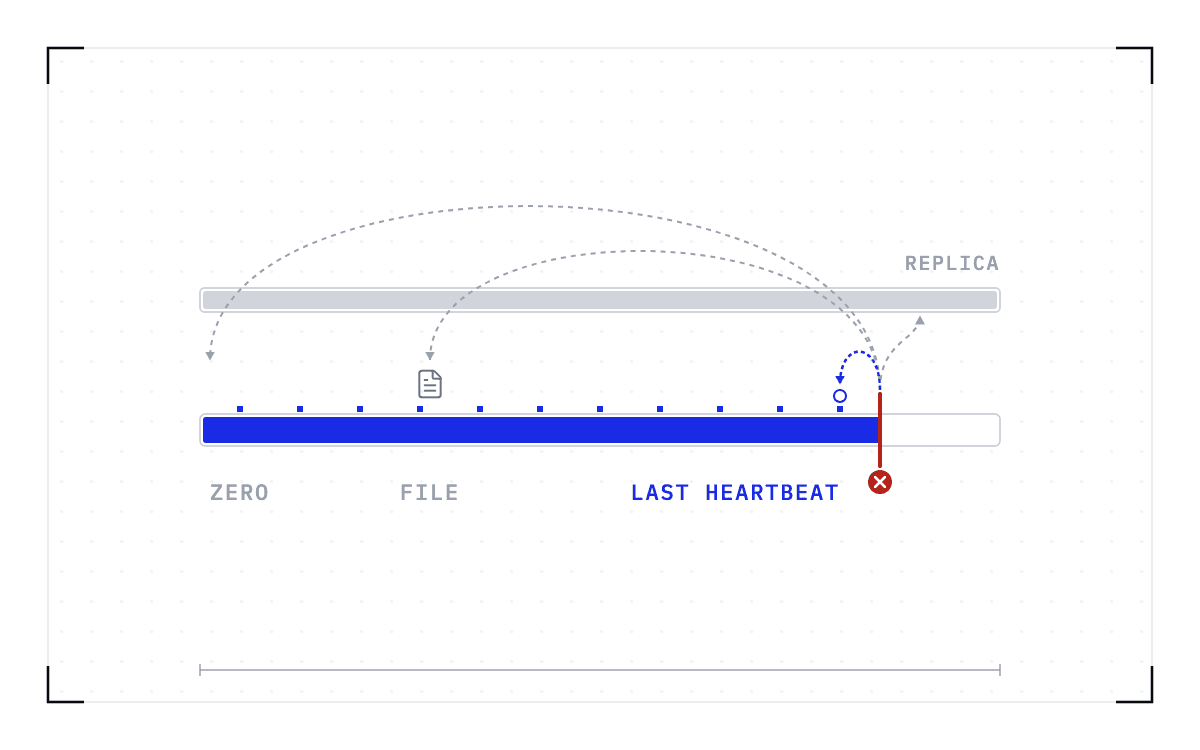
Cedana. Blueprint of a long progress track filled blue up to a red cut, with small blue heartbeat marks along it and a grey document icon standing some way back. From the cut, grey dashed arcs loop back to the very start of the track and to the document, another climbs to a second grey lane above that runs on unbroken, and a short blue arc drops to the last heartbeat mark just before the cut.
· Cedana Editorial

What torchrun, torchft and Ray Train restart from when a node dies

Compare how torchrun, torchft, Ray Train and Kubeflow recover after a node fails, including saved state, code changes and checkpoint intervals.

read →

Showing 12 of 13 posts