

TL;DR
- Your worker takes minutes, not seconds, to go from process start to serving a request. A cold start is the sum of pulling an image, reading weights off storage, writing them into GPU memory, bringing up communication between the GPUs, profiling the cache, compiling, and capturing CUDA graphs.
- Every published fix shortens some of those steps and leaves the rest to run in full. The next replica you start runs all of it again.
- The engine also reports ready before it is warm, so the first real requests pay for compiling and graph capture that the start deferred.
- A checkpoint is a different kind of answer, because a restore brings back the state the whole sequence produced instead of running the sequence again. The checkpoint has to exist first, which means paying one full cold start per model and version to make it.
- In this piece we walk through where the minutes of a vLLM cold start go, what each published fix covers and what it leaves behind, and why readiness is not warmth. Then we cover what a restore cost on the node we measured, what your storage path does to that number, and what has to be true before a checkpoint can replace a start.
How long does a vLLM cold start take?
A vLLM cold start takes minutes, and the public bug reports run a good deal longer than that. After a fresh deploy, your time to first token includes the worker's startup, and a slow vLLM startup time is the most common version of the complaint. One engineer measures about 8 minutes from process start to the service reporting ready. On the TensorRT-LLM tracker, another gets "18+ min, never serves". A third spent about 1 hour loading llama2-7b-hf, a 7B model. These are not one broken setup: the same complaint runs across the vLLM, SGLang, TensorRT-LLM, KServe, Triton, and Hugging Face trackers.
Serving platforms tell their users to expect the wait rather than to treat it as a bug. KServe's runtime overview says "Slow first inference: This is expected due to model loading and CUDA initialization."
Model loading time is the largest part of a GPU cold start
Model loading moves weights from storage into accelerator memory, and at frontier size the weights occupy most of a node's GPU memory. Kimi K2.6 ships as 64 shards totaling 595 GB, and an 8-GPU H200 node holds 1,128 GB, so the weights alone take 53% of the node. DeepSeek-V4-Pro's 865 GB take 77%. Both sums come from the file listings in the model repositories.
The steps that follow the weights take minutes of their own: the engine brings up the communication between the GPUs, measures the memory left over and reserves it for the key-value (KV) cache, runs torch.compile, and captures the CUDA graphs it will replay for each request. Alibaba Cloud's deployment documentation puts the load of a full-version DeepSeek-R1 at 20 to 30 minutes on the 8-GPU node it requires. These steps run in order, so a stall in any one of them holds every GPU assigned to the worker idle.
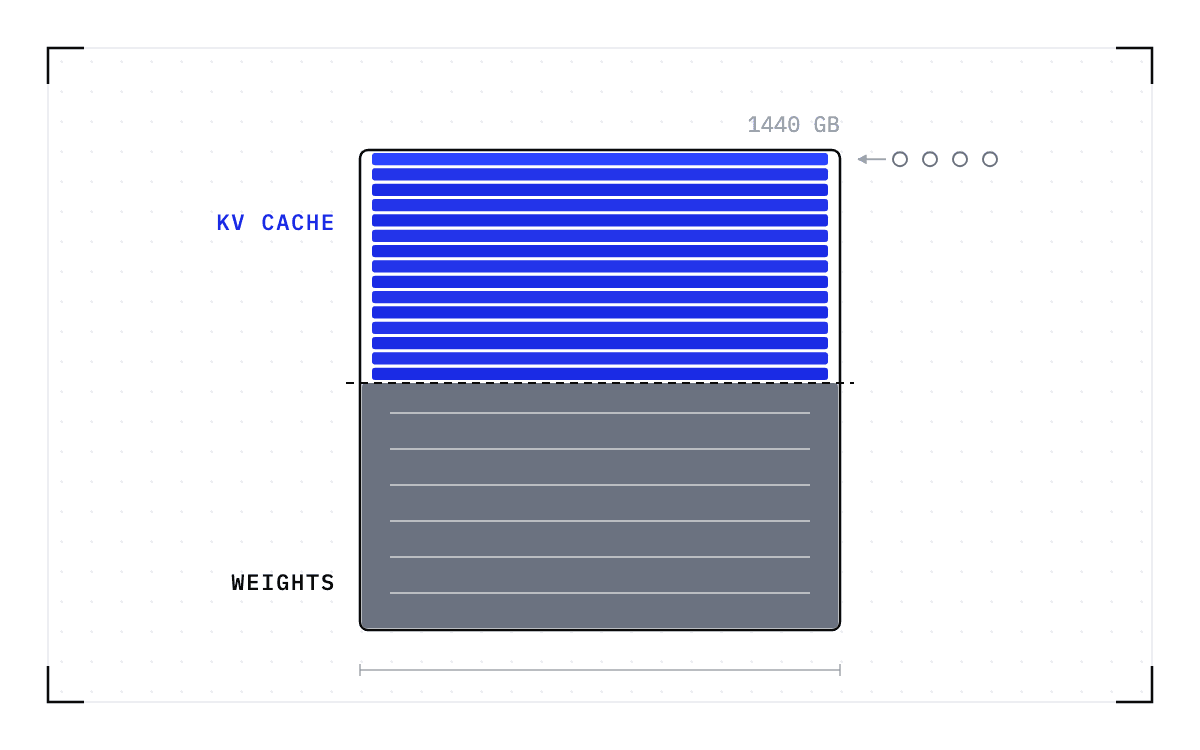
A serving worker holds more than the weights, because the KV cache carries the attention state of every request in flight, and Together AI reports raising the cache capacity on a single NVIDIA HGX B200 node "from roughly 1.2M tokens to 3.7M tokens". None of that state exists anywhere but GPU memory, so it is gone the moment the worker stops.
Every published fix shortens some steps and leaves the rest
Each vendor fix names the step it addresses, and its own description tells you what it leaves behind.
Weight loading has the most answers, starting with holding the bytes nearer the GPU. Baseten's delivery network is "a tiered caching system that eliminates upstream dependencies at runtime, making cold starts 2-3x faster and more reliable". KServe offers a node-local cache, and its aim is that "By caching LLM models locally, the InferenceService startup time can be greatly improved", though it needs "Nodes with NVMe storage available" and "By default, model caching is disabled in KServe".
NVIDIA's Run:ai Model Streamer is "a Python SDK designed to facilitate the streaming of tensors from tensors files to GPU memory with concurrency and streaming", which vLLM accepts as a load format. RunPod tells you to cache the model or bake it into the image, and NVIDIA NIM's own answer to a cold start is a download-to-cache command that fills a local cache before the container runs. None of those five answers keeps a started process.
Compilation and capture have answers of their own: carry the compiled artifact with you, or skip the work and give up steady-state decode performance. vLLM's tuning page says its torch.compile cache "can be copied between machines or baked into a container image", and that the --enforce-eager flag "Skips both compilation and CUDA-graph capture for the fastest possible startup, at the cost of steady-state decode performance". Baseten persists the same artifacts, so that "a new replica can reuse them instead of compiling from scratch".
Stacking them works, up to a point. Tensorfuse published a start that went "from 294 seconds down to 82 seconds" after caching the model and limiting the CUDA graph sizes captured. What remains inside those 82 seconds is weight loading, compilation, capture, and engine initialization, and the next replica you start runs all of it again. Each fix shortens some steps, and the sum is still paid per replica.
The engine reports ready before the warmup is over
Your engine can report ready before it is warm. Engineers describe a service that launches successfully and then takes the first two or three requests extremely slowly, often slowly enough for the client to time out.
The work is not missing, it is deferred, and NVIDIA's Triton documentation says so. "For some backends, some or all of this initialization is deferred until the model receives its first inference request (or first few inference requests). As a result, the first (few) inference requests can be significantly slower due to deferred initialization." Triton's answer is ModelWarmup, a set of synthetic requests run before the model is marked ready, and it publishes the side effect: "it will cause Triton to be less responsive to model update".
The advice these engineers get is always to make an explicit warm-up call before real traffic. The same deferred initialization is why you take the checkpoint after the warmup rather than before it. A checkpoint captured the moment an engine reports ready still contains that deferred work, so every restore from it would leave the first real request waiting for initialization. Take the checkpoint after the warmup to save the initialized state.
What a restore costs on the node we measured
The table below times two paths to the same endpoint, an engine initialized and ready to serve. The native SGLang startup is timed from engine launch to ready-to-serve, including weight loading and full engine initialization. The restore clock covers bringing that same fully initialized engine back from a checkpoint until it can serve.
Every run used one node with 8x NVIDIA B200 GPUs and 1.7 TB of system memory, on CUDA 12.9. Each model was served by SGLang from its official cookbook recipe, unmodified. The checkpoints were read from tmpfs, a file system that lives in the node's own memory rather than on disk or across a network.
| Model | Parameters | Checkpoint | Native start | Restore |
|---|---|---|---|---|
| MiniMax-M2.7 | 229B | 244 GiB | 564 s | 57 s |
| GLM-5.2-FP8 | 753B | 734 GiB | 1,322 s | 61 s |
| Kimi-K2.6 | 1100B | 670 GiB | 1,217 s | 63 s |
| DeepSeek-V4-Pro | 1,600B | 873 GiB | 2,051 s | 70 s |
Restore time follows the size of the checkpoint, meaning how many bytes have to move, not the parameter count. Across those four rows, the parameter count grows sevenfold and the checkpoint grows by a factor of 3.6, while restore time varies by a factor of 1.2, a band of 13 seconds. On this node the restore column barely moves, and four rows cannot show more than that. A ten-minute initialization becomes a state copy.
The storage path sets the floor under those numbers
Tmpfs is the fastest path available, so treat the restore column as a floor rather than a promise about your fleet. A restore has to move every saved byte from the checkpoint back into memory before execution continues. The largest checkpoint in the set, 873 GiB, is about 937 GB. Over a 10 gigabit link at 1.25 GB/s that is about 12.5 minutes of transfer, and off local NVMe at about 10 GB/s it is about 94 seconds. Those are floors for those paths, not our measured times on them.
Restoring also costs more than checkpointing over the same storage. On a 1 GB workload we measured 21 seconds to write a checkpoint to S3 and 34 seconds to read it back, and 9 seconds against 13 seconds on NFS. A save has slack that a restore does not, because the workload can carry on while its bytes are still being written. Nothing continues during a restore until the last byte is back and the GPU contexts and the communication state are rebuilt.
For planning, divide your checkpoint's bytes by the bandwidth of the path they come back over, then allow time for that rebuild.
What has to be true before a checkpoint can replace a start
The checkpoint has to exist. Each model's cold start runs once to produce it, and an engine, driver, or model upgrade means running it again, one cold start per model.
The restore lands on a compatible node. A checkpoint records the GPU, driver, engine and model versions it was taken against. If any of them changes, the checkpoint is invalid and the workload cold-starts instead.
A checkpoint does not make weight loading faster. Modal states the same limit for its own product: "GPU Memory Snapshots do not speed up model loading from storage." What a restore removes is the need to build the state a second time, and the bytes still have to travel, which is why the storage path above sets the floor.
The engine build sits outside all of it. Spheron puts a 70B TensorRT-LLM engine's build time on an H200 at "25-45 minutes for FP16, and 35-60 minutes with FP8". The build is paid once whichever way the engine is later started.
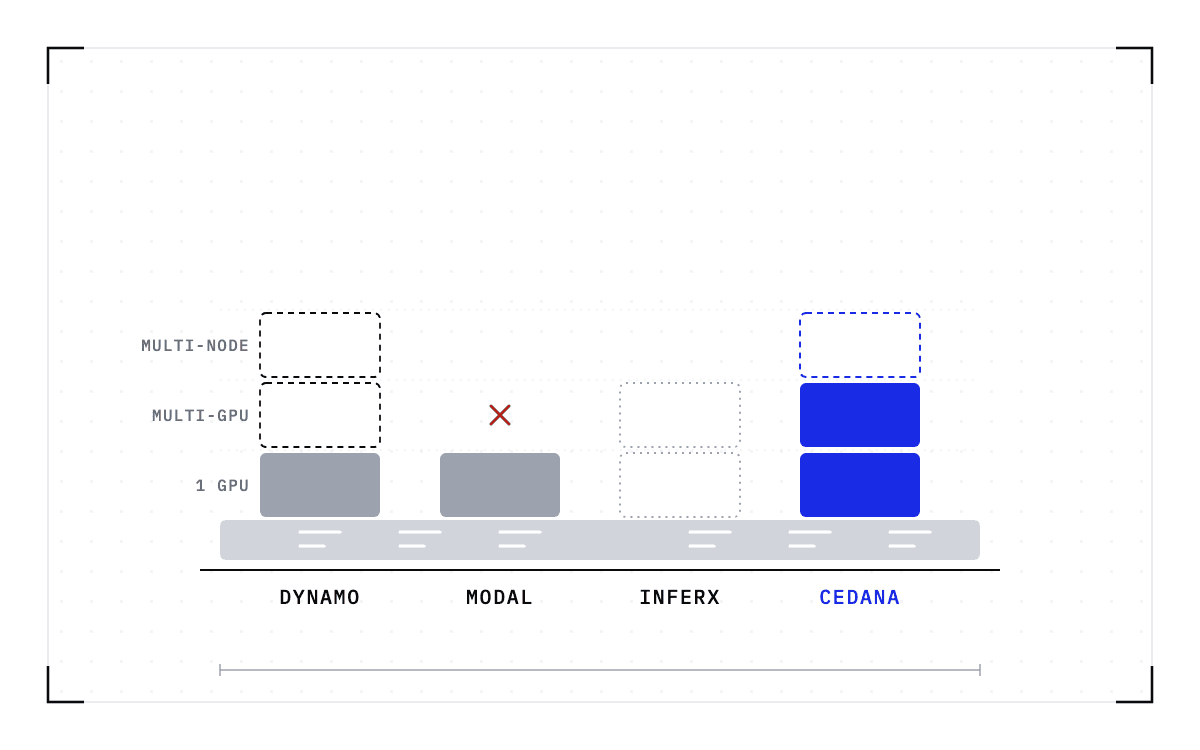
The benchmark above was measured on a single machine. The single-GPU and multi-GPU-on-a-single-node tiers ship in production today. Multi-node, where a single workload spans hundreds or thousands of GPUs across many nodes, is in design partnership with leading enterprises and neoclouds.
A faster start also does not fix an autoscaler that decides late. Engineers on the Knative and KServe trackers report replicas arriving after the spike has passed, and part of that gap is the time the autoscaler takes to read its metrics and act. A restore shortens the part of the delay that belongs to the worker.
Put those conditions together and the sequence at the top of this page runs once per model and version instead of once per replica. We capture the worker at Cedana below the serving engine once it is initialized and warm, with no change to your application code, and bring that state back when the next replica is needed. Cedana is automated GPU checkpointing and migration infrastructure that increases the useful work your GPUs deliver. On a serving fleet, that means the minutes go into making the checkpoint, and what every later start costs you is a transfer you can measure on your own storage path.
Related:
- Can LLM inference scale to zero without paying for warm replicas?
- How to swap models on one GPU without a cold start
- What NVIDIA Dynamo Snapshot and Modal GPU memory snapshots restore today
- Your KV cache now rivals your weights
- Does disaggregated serving remove the need to move GPU workers?
- KV-cache offload versus a saved worker: what each survives
Common questions
My vLLM or TensorRT-LLM worker takes minutes to start. How do I make that fast?
A cold start is the sum of pulling an image, reading weights off storage, writing them into GPU memory, bringing up communication between the GPUs, profiling the cache, compiling, and capturing CUDA graphs. Cached weights, streamed tensors and a persisted compile cache each shorten some of those steps, and the rest still run in full on every replica you start. A checkpoint taken after the engine is warm brings back the state that whole sequence produced, so you run the sequence once per model and version rather than once per replica.
My engine reports ready, but the first few requests are extremely slow. Why, and how do I fix it?
For some backends, compiling and graph capture are deferred until the first real request, so your engine is marked ready while that work is still outstanding and the first two or three requests pay for it. Make an explicit warm-up call before you send real traffic. If you are checkpointing the worker, take the checkpoint after that warm-up, because a checkpoint taken the moment the engine reported ready still carries the deferred work.
My autoscaler adds a replica once traffic picks up, but the spike has already passed by the time it starts. Does a faster start fix that?
Not by itself. Part of that gap is the time the autoscaler itself takes to read its metrics and decide to act, so a restore only shortens the part of the delay that belongs to the worker. What a warm pool costs to cover the rest of that gap is on Can LLM inference scale to zero without paying for warm replicas?.