

TL;DR
- If you buy GPU capacity you watch cost per token, and if you sell it you watch revenue per megawatt. Both are a fixed cost set against delivered tokens, read from opposite sides, so the same lever moves both.
- Both fixed sides are already locked. The monthly bill is signed whatever the traffic does, and a data center may draw only the megawatts its interconnection agreement with the utility allows.
- A newer GPU generation raises the ceiling on what an hour can produce, but it does not decide how much of that ceiling you collect. The utilization number on your dashboard does not tell you either. It reports that a GPU is busy and not that the busy hours delivered tokens.
- What is left is delivered output, and it leaks in three places: cold starts, failures, and immobility. Saving the state of a running GPU workload, moving it, and resuming it elsewhere turns those hours back into delivered tokens. That lowers cost per token on the buyer's side and raises revenue per megawatt on the seller's.
- In this piece we walk through what each fraction is made of, why utilization is the term still in play after the hardware is bought, and where the delivered output leaks. Then we cover how to work your own cost per token out of the bill and the serving logs, and what the three taxes have in common.
Both numbers move only on delivered output
Cost per token and revenue per megawatt are two fractions, not one, and after the hardware is bought the same single term moves in both of them. Cost per token, the number an enterprise watches once it serves models on hardware it pays for, is the fleet's fixed cost divided by the tokens it delivers. Revenue per megawatt is what a fleet earns from the tokens it delivers, divided by the megawatts it may draw.
The fixed term on each side, the monthly bill and the megawatts, was settled before the first request arrived. An enterprise that bought or reserved GPUs pays the same monthly bill whatever the traffic does, made up of amortized hardware or a rental rate, plus power and hosting. A data center may draw only as many megawatts as its interconnection agreement with the utility allows, and that ceiling does not move when demand does. So what is left on both sides is delivered output.
| If you buy the compute | If you sell it | |
|---|---|---|
| The fixed term | The monthly bill, amortized hardware or rent, plus power and hosting | The megawatts the site may draw, set by the interconnection agreement |
| The delivered term | Tokens delivered per GPU-hour, counted from completed requests | Tokens delivered per megawatt, and the revenue they earn |
| What it is called | Cost per token, or cost per task | Revenue per megawatt, or tokens per megawatt |
| Who answers for it | Whoever signed the case to run models in house | Whoever reports fleet yield to the board |
The buyer divides the fixed cost by the delivered tokens, while the seller divides the delivered tokens by the fixed megawatts. Both measure delivered output over a fixed fleet, so delivering more tokens from the same fleet lowers the buyer's cost per token and raises the seller's revenue per megawatt.
Utilization is the one term still in play after the hardware is bought
Cost per token became the scoreboard because it is the one number that includes what the hardware did after it was paid for. NVIDIA's April 2026 post on cost per token puts the case in terms of TCO, total cost of ownership, meaning the full bill for the hardware over its life: "Cost per token determines whether enterprises can profitably scale AI. It's the one TCO metric that directly accounts for hardware performance, software optimization, ecosystem support and real-world utilization."
Two of the four terms NVIDIA lists were settled before the fleet served anything, because hardware performance was decided when the GPUs were chosen and software optimization is a property of the serving stack. Real-world utilization, the share of the paid-for hours that produced tokens, is the term a fleet still controls after the purchase order clears.
Each hardware generation raises the ceiling on what an hour can produce. NVIDIA reports from its own measurements that Blackwell delivers more than 50x greater token output per watt than Hopper, and nearly 35x lower cost per million tokens. Those are vendor figures for one generation against the one before it, and they describe a ceiling, so how much of that output you collect still depends on how your GPU-hours are spent.
NVIDIA's post makes the same link to the seller's side: delivering more tokens per second also translates to more tokens per megawatt. The buyer's denominator and the seller's numerator are the same delivered tokens, so anything that raises them moves both scoreboards at once.
Power is the input a data center cannot buy more of
A neocloud, meaning a provider whose early business was renting bare-metal GPU capacity, can buy more GPUs and sell more capacity, but it cannot pull one megawatt more through the interconnection than its agreement allows. So every GPU-hour that sits idle under a provisioned megawatt is revenue that megawatt was meant to earn, which is why revenue per megawatt is the metric a neocloud board tracks.
The grid is a second buyer for power the fleet can free up at a peak moment. Grid programs pay a data center to reduce its draw during peak events, and two field trials run through EPRI's DCFlex initiative have shown GPU clusters doing it.
The first ran in Phoenix, on a 256-GPU cluster built on NVIDIA A100 GPUs. A July 2025 preprint by Colangelo, Coskun, Sivaram, and colleagues reports a 25% cut in cluster power usage for 3 hours during peak grid events, with the cluster's quality of service guarantees maintained. The cut came from work that could wait, because batch-style training and fine-tuning could be slowed or paused while real-time inference and model serving were not modified.
The second ran in London, on training workloads, and a March 2026 report in The Register describes it rather than a paper. A cluster of more than 200 NVIDIA Blackwell Ultra GPUs reduced its power consumption by up to 40% during grid events, by pausing or deprioritizing the jobs running on it or shifting them to a later time. The two figures come from different trials on different fleets, so keep them apart rather than reading them as one range. What the grid paid for in both cases was work that could be put down and picked back up.
The other term of the seller's fraction is the price, and it moves no more easily than the power does. McKinsey's article on where the neoclouds go next describes the economics of bare-metal GPU rental as fragile, with gross margins that can look healthy until hardware depreciation, financing costs, and chip refresh cycles are counted. Third-party inference is a price-taker market selling a largely undifferentiated token, so margins are thin and set by what buyers will pay.
A seller who cannot raise the price and cannot buy more power has one lever left, and it is the same one the buyer has: the tokens the fleet delivers in hours it is already paying for.
Delivered output leaks in three places
Cold starts, failures, and immobility are where the hours go. Published measurements exist for all three, but each one describes the fleet that was studied.
A cold start is the time between launching a model and serving its first token, and on a frontier-scale model that time is long. Alibaba Cloud's documentation for deploying DeepSeek says that "for a large model, such as the full-version DeepSeek-R1, the model loading process might take 20 to 30 minutes." Nobody serving live traffic can wait that long for a replica, so operators keep warm replicas, meaning model instances loaded and left idle, ready for demand that may or may not arrive. Holding them turns an elasticity problem into an overprovisioning problem, and the idle hours are hours the fleet pays for and cannot sell.
Microsoft has sized that tax on one real fleet: its SageServe paper, on Office 365 inference traffic, projects monthly savings of up to $2.5 million and up to 25% of GPU-hours against the current baseline deployment, by scheduling around slow starts. Every cold start it schedules around still happens, so the figure is a floor on the tax rather than the whole of it.
The second tax is failure, and it has been measured on two different kinds of fleet. Kokolis and colleagues at Meta studied their own research clusters of A100 GPUs and report that attributed hardware failures touch 19% of GPU runtime and less than 1% of jobs. That figure rests on the paper's own recovery assumption, which is that jobs checkpoint hourly, so each failure loses half an hour of work on average. Failures there are rare by job count and expensive by runtime, and runtime is what the fleet pays for.
Chu, Hofstaetter and colleagues at Vrije Universiteit Amsterdam read the job data from SURF Lisa, a Dutch national HPC cluster, and found that about 50% of the total cluster energy went to jobs that terminated unsuccessfully. That figure measures energy rather than tokens, and it comes from a cluster whose workload mix differs from a neocloud's. It is still half of what the machine drew, spent on work that did not finish.
The third tax has no event attached to it. The USENIX ATC 2023 paper "Beware of Fragmentation", by Weng and colleagues, describes a cluster that was fully packed and could not take a new task while 500 of its GPUs sat unallocated, because the free GPUs were scattered across the cluster in pieces the waiting tasks could not use. That state was measured on Alibaba production traces replayed on a cluster of more than 6,200 GPUs, so it is an example and not a figure for anybody else's fleet. On a neocloud the same state is capacity that is powered and cannot be sold, and since nothing failed, nothing shows up as an incident.
The dashboard number does not tell you how much work got done
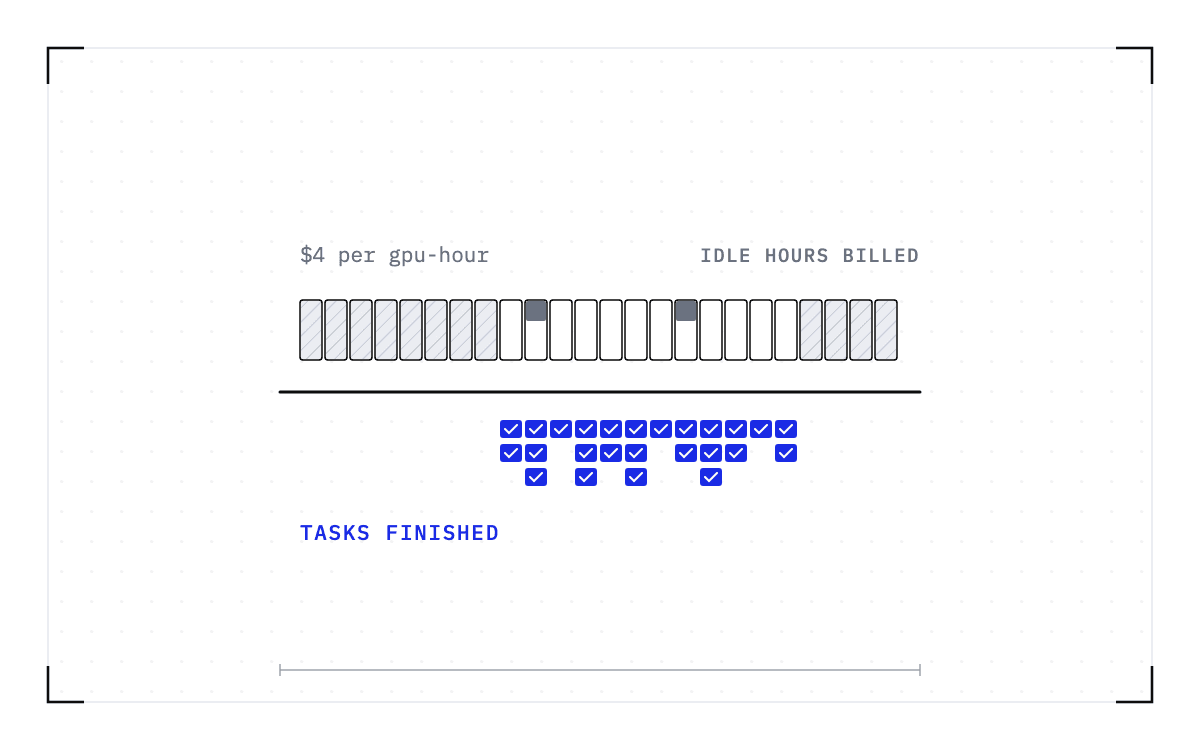
Utilization on a dashboard reports whether a GPU is busy, not whether the busy time produced anything. A fleet could in theory report 90% GPU utilization and have an effective job throughput of zero, because a GPU re-running a failed job or holding a warm replica is busy and delivers no tokens. The fleet paid for all of those hours, and on a neocloud each of them drew power under a provisioned megawatt.
The arithmetic reads more clearly in hours than as a percentage. Every GPU-hour on the bill either delivers tokens or does not. Some of the hours that deliver no tokens had no demand to serve, and the rest are spent starting, held warm against a slow start, re-running what a failure destroyed, or stranded on GPUs no job can reach. A fleet that reads only the dashboard reports a healthy cluster while those hours reduce the tokens it delivers.
The two sides of the market lose those hours by different routes. An inference platform over-provisions because of how it deploys, holding more capacity live than the average load needs so that a slow start never reaches a user as latency. Based on our experience and discussions with providers, that over-provisioning ranges from 20 to 80% depending on the model portfolio hosted, meaning how many different models the platform has to keep ready. A shared cluster loses the hours the other way, because its users choose how many GPUs a job gets and ask for more than the job uses.
The bill and the serving logs are all the calculation needs
Your own cost per token comes out of the monthly bill and the serving logs, in four steps.
- Take the fleet's monthly cost, amortized hardware or the rental bill, plus power and hosting.
- Count the tokens the fleet delivered that month, from the serving logs, for completed requests only.
- Divide the first number by the second. That is your cost per token, and it is also your cost per GPU-hour over your delivered tokens per GPU-hour, the form NVIDIA describes.
- Compare the tokens the fleet delivered against what the same fleet would deliver at steady state, meaning every paid-for GPU-hour serving the same workload at the rate it serves once a model is loaded and running. The gap between the two is the output you paid for and did not get. Hours when there was no demand to serve are part of that gap, and the three taxes are the part of it you can act on.
Take a $3 million cluster running at 30% utilization. Amortized over 36 months, and leaving power and hosting out, it bills about $83,000 a month whatever the GPUs do, and about $58,000 of that bought no work. At 80% delivered hours, the same bill buys 2.7 times as much, so cost per token is divided by 2.7 without another purchase. Those figures follow from the assumptions, and none of them is a customer's data.
A neocloud runs the same steps with different inputs: the month's token revenue in place of the cost, and the megawatts it may draw in place of the bill, so the answer reads as revenue per megawatt.
The person responsible for the fleet's fixed cost or power budget should also be accountable for its output. At a neocloud that is the person who reports fleet yield to the board. At an enterprise it is whoever signed the case to run models in house, because the case was approved on cost per token or cost per task, and the three taxes affect that same measure.
Once you serve on capacity rented by the hour or owned outright, you are responsible for the fleet's output. If you buy inference through an API, that responsibility remains with the provider, which measures output against its power budget.
The three taxes have one cause
Cold starts, failures, and immobility arrive on different dashboards but share the same limit: a fleet cannot save the state of a running workload, meaning everything the workload built up while running that would otherwise have to be built again, and it cannot move it. A cold start rebuilds that state from nothing because nothing saved it. A failure destroys the same state for the same reason. Immobility is the case where the state exists and cannot follow the hardware it needs.
The ability to save a running GPU workload's full state, move it, and resume it on other hardware changes all three. Cold starts become restores. Failures become resumes. Stranded placement becomes a scheduling decision instead of a sunk cost.
Saving and moving that state is what we build at Cedana, and restores are the part we have measured. On a node of 8 B200 GPUs, Kimi K2.6, a trillion-parameter model with a 670 GiB checkpoint, resumed in 63 seconds in our published benchmark, where the native start of the same model on the same hardware took 20.3 minutes. Those runs held their checkpoints in tmpfs, a file system in the node's own memory rather than on a disk, so the times are what a restore costs with the checkpoint already on the node.
Failure recovery and better placement use the same saved state. A job saved at intervals while it runs comes back from its last checkpoint on healthy hardware, so a failure costs the resume time plus the work since that checkpoint and nothing before it. A job that can be moved can also be placed where the free GPUs are. Across the three, Cedana's own figure for the utilization its deployments reach is 60 to 85%, a range we state from our own experience rather than a published measurement.
So one layer underneath the workload closes all three leaks. Cedana is automated GPU checkpointing and migration infrastructure that increases the useful work your GPUs deliver. On the two numbers this piece is about, that means GPU-hours that were initializing, recomputing, or stranded go back to delivering tokens. If you buy the compute, you read that as a lower cost per token, and if you sell it, you read it as more revenue under the same megawatt.
Related:
- Which utilization number goes into your own-versus-rent calculation?
- How to put a dollar figure on the GPU-hours that produced nothing
- Tasks per dollar: the economics of running your own coding models
- The fleet's real yield metric is tokens per gigabyte of VRAM
Common questions
What does it cost, per token, to run a model yourself once you count hardware, power and utilization?
Take the fleet's monthly cost, amortized hardware or the rental bill plus power and hosting, and divide it by the tokens the fleet delivered that month from completed requests only. A $3 million cluster amortized over 36 months, with power and hosting left out, bills about $83,000 a month whatever the GPUs do. At 30% utilization about $58,000 of that buys no work, and at 80% delivered hours the same bill buys 2.7 times as much, so cost per token is divided by 2.7 without another purchase.
How much is idle, queued, or unused GPU capacity costing us, and does a high utilization number even mean the GPUs are doing useful work?
A high utilization number tells you the GPUs are busy, not that they are delivering. A fleet could report 90% GPU utilization and have an effective job throughput of zero, because a GPU re-running a failed job or holding a warm replica is busy and delivers no tokens. Cold starts, failures, and immobility are the three places delivered output leaks, so a fleet that reads only the dashboard reports a healthy cluster while those hours reduce the tokens it delivers.
What's the right yardstick to compare what different GPUs, generations or providers deliver for the money, and how do I compute it for my own fleet?
Divide the fleet's monthly cost by the tokens it delivered that month for completed requests only. That is cost per token, which is also cost per GPU-hour over delivered tokens per GPU-hour. A neocloud runs the same steps with revenue instead of cost and provisioned megawatts instead of the bill, then reads the answer as revenue per megawatt.