

TL;DR
- Your job was killed for memory, and the work it had done is gone unless something saved it while it ran. The kill can come from three different limits: the machine's memory, the limit set on your container or job, or the GPU's own memory. That is why a container can be OOMKilled while the node still has memory to spare.
- The kernel kills rather than pauses because ending a process is the only action that hands memory back. It picks the victim by a score that usually lands on the long-running process holding the most memory, which is your job.
- Everything people do about it today, asking for more memory, adjusting the killer, earlyoom, Ray's memory monitor, still ends the process. It changes who gets picked and how much notice they get.
- If the job was checkpointed while it ran, it can give up its memory without giving up its work. The system frees the memory, and the job resumes from its last checkpoint on a node with more.
- In this piece we walk through what the oom-kill message means, why a job dies with memory to spare, why the kernel kills instead of pausing, and how it chooses. Then we cover what the message leaves out and where the record is, why a killed worker can leave the job hanging, what people do today, and what changes when the job can be saved instead.
What does an oom-kill event mean?
A job that had been running for hours is gone, and the only trace is one line about memory. You may have seen it as "slurmstepd: error: Detected 1 oom-kill event(s)", as OOMKilled with exit code 137, or as the word Killed in dmesg. If nothing saved the job's state before it was killed, the work it had done is gone, and no command run afterwards brings it back. Everything below is about the next run.
The message means the operating system ended your process on purpose, because the memory it was using crossed a limit. Either the machine itself ran out and the kernel stepped in, or the process hit a cgroup limit set above it. A cgroup, short for control group, is the kernel feature that caps what a process or a group of processes may use. The signal sent is SIGKILL, which cannot be caught or handled, so nothing in your job ran on the way out and there was no warning. The kill can take the GPU with it too. On the NVIDIA forums, whenever a process using an A100 was killed by the OOM killer the GPU froze, nvidia-smi stalled, and the only recovery the poster found was a reboot of the whole server.
Where you see the message depends on what is running the job. On Kubernetes the pod status records OOMKilled, the container exits with code 137, and the restart policy brings it back from zero. An init container is killed and restarted the same way, and the pod sits in PodInitializing while that repeats, as one report on Server Fault found with an init container that used the GPU. On Slurm the step dies and the log carries the slurmstepd line, sometimes with a second line about the cgroup out-of-memory handler. On a bare machine the kernel writes the event to its own log, where dmesg prints it, and the shell may show nothing more than the word Killed.
One message that looks similar is a different problem. If PyTorch said CUDA out of memory, the model does not fit on the GPU. That is not the host-memory kill described here, and the table below lists it only so you can tell the two apart.
Why was my job OOMKilled even though the node had memory to spare?
Three different memory limits can end a job, and each has a different owner. The node's physical memory belongs to the kernel. The container's or job's memory limit is set by whoever wrote the pod spec or the Slurm allocation, and the kernel enforces it through cgroups. The GPU's own memory is fixed by the hardware. Those three limits are enforced along five paths.
| The layer | What triggers the kill | Who sets the limit |
|---|---|---|
| The node | Memory is exhausted and the kernel cannot reclaim enough to keep operating | The machine's physical memory |
| The container | The container's memory limit is exceeded and the kernel detects memory pressure. The recorded reason is OOMKilled | The operator, in the pod spec |
| The node, before the kernel acts | The kubelet terminates pods to reclaim resources, ranking candidates by priority and then by how far usage exceeds the request | The kubelet's eviction thresholds |
| The Slurm job | The job or step exceeds the hard limit sitting above its allocation | The user's own memory request |
| The GPU | An allocation does not fit in device memory and the framework raises an error | The hardware |
The Slurm row is worth a second look, because the number that kills the job is your own. Slurm's cgroup plugin constrains a job to the memory it was allocated and sets a hard limit above that. Exceeding the hard limit can trigger an oom-kill, so requesting too little memory can get your own job killed.
What counts against the limit?
The people reporting this were watching a number that said there was room. "I am running the job with 'mem=950G' (which is maximum)", writes one on r/HPC, "Always resulting in OOM-kill." Another, on Server Fault, sees the kill "even though there is still plenty of memory available".
Two things explain most of these reports. The limit that fired applies to a smaller unit than the one you were watching, a job step inside the job or a container inside the pod. And the kernel counts memory the dashboard does not: page cache, huge pages, and page-table memory all count against a cgroup limit. The kernel log records what it counted at the moment of the kill, and that record, not the dashboard, says what went over.
Why does the system kill the job instead of pausing it?
Ending a process is the one action guaranteed to hand memory back. When a machine runs out of memory and the Linux kernel cannot reclaim enough to keep operating, it invokes the out-of-memory killer, which the kernel's administration guide says "selects a task to sacrifice for the sake of the overall system health". It works without anyone deciding what the process was doing or what it was worth.
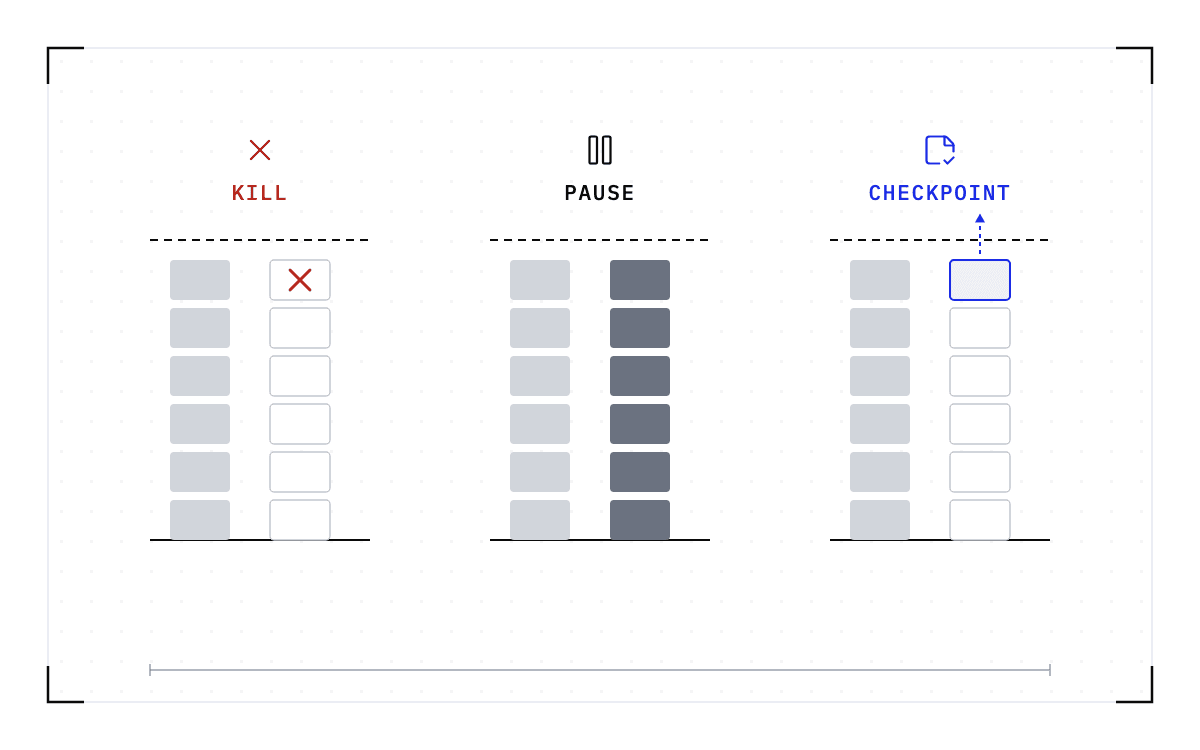
Pausing would do nothing at that moment, because a paused process still holds every byte it held a second earlier. At the point of exhaustion, the only choices are to end the process or to save its state and then end it. Whether Linux can warn you before that point, and what a warning like earlyoom or systemd-oomd buys you, is answered in full in Can Linux pause a process instead of killing it when memory runs out?.
What none of these systems can see is the value of the work. The kernel sees pages, and the kubelet, the agent Kubernetes runs on every node, sees pods. Neither one sees the hours of computation inside the thing it is about to terminate, and neither one has an action that would preserve it.
How does the OOM killer decide which process to kill?
The kernel ranks the candidates. It gives each one a number often called the badness score, and the process holding the most memory is usually the one that goes. A long run with a large resident set is the natural victim.
A bigger limit does not always help. If the program leaks memory, the extra headroom buys time and the kill comes back later. Finding a leak is its own piece of work, and nothing here substitutes for it.
What the message does not tell you
It does not say what counted against the limit. On Slurm, the limit that fired may belong to the whole job or to one step inside it. In a container, it may be the container's own limit rather than the pod's total. Whether page cache counted against you is a third version of the same question. These are kernel and scheduler accounting questions, and nothing here changes them.
Where to read the record depends on what killed the job. On a bare machine the kernel log holds the event and dmesg prints it. On Kubernetes the kubelet's journal on the node holds the same event, and kubectl describe shows the pod's last state as OOMKilled with exit code 137. On Slurm, sacct and seff report the job afterwards, and MaxRSS reports the peak memory the accounting saw. One catch: Slurm's configuration documentation sets the default task-usage sampling interval at 30 seconds, so a short memory spike can fall between samples and never appear in the peak the accounting reports.
A worker was killed and the job hung instead of failing
The kill does not always land on the process you are watching. In a training job the victim is often a data loader worker, a child process the main process started, and what you get to read depends on the framework and its version. A 2018 report on PyTorch's tracker shows the whole message: "RuntimeError: DataLoader worker (pid 4161) is killed by signal: Killed", with nothing about memory in it. When the memory that ran out was the shared memory in /dev/shm, the reports were worse. A request for a better error, also from 2018, shows the message as "RuntimeError: DataLoader worker (pid 13) is killed by signal: Bus error", and a contributor's own report traces it to a "Bus error" that dumps core "with no stack trace, error message, etc." By 2023 the message named the cause: "It is possible that dataloader's workers are out of shared memory. Please try to raise your shared memory limit". An inference container on the NVIDIA forums says the same thing in its own words: "ERROR: Unexpected bus error encountered in worker. This might be caused by insufficient shared memory (shm)."
The main process is not the one that died, so whether the job fails cleanly is up to the code around the worker. PyTorch raises the error above and the run stops. A main process that keeps waiting on a worker that no longer exists waits until something outside kills it too, which is the hang people describe, and the fix on that side is for the main process to notice a dead child and exit, which is code you write. A pipeline that runs its steps in sequence can carry on to the next step and write a log that reads as a normal finish. In one genomics pipeline on Slurm, Slurm marked the job out of memory while the tool's own log, in the researcher's words, "seemed that the pipeline has completed".
So a bare Killed or Bus error gets its cause from the record, not from the framework. The kernel log names the process it killed, and on Slurm the step's oom-kill count says a kill happened even when the job's own log does not. When the cause is shared memory, the fix people converge on is a larger /dev/shm: Docker's --shm-size sets the "Size of /dev/shm" for a container, and on Kubernetes the usual route is a memory-backed emptyDir volume mounted at /dev/shm. Either way the run is over. The worker's death takes the step it was feeding with it, and the work before the kill is gone unless something saved it, which is where this page ends.
What do people do about this today?
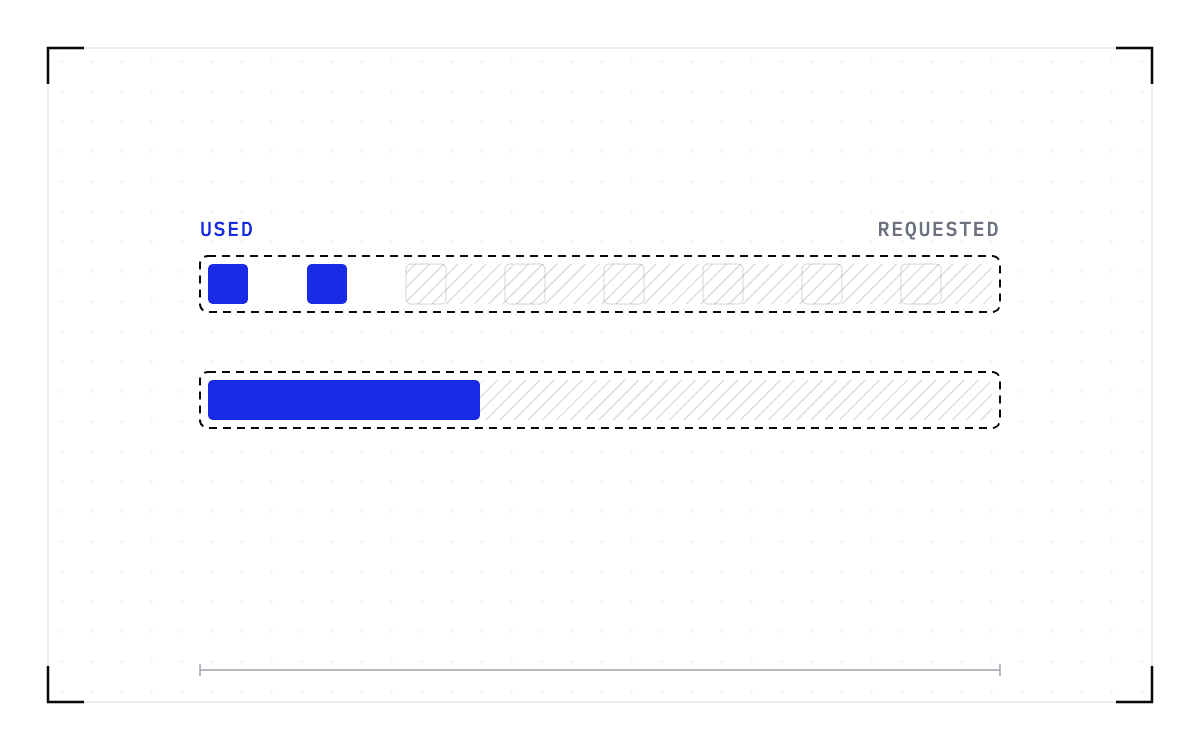
They ask for more memory. Every university page we found that documents the oom-kill message opens with that answer: raise --mem or --mem-per-cpu, then read seff and MaxRSS afterwards and adjust the next submission. That is correct, and it is a guess made before the run starts.
Two settings change who is killed or when. Setting oom_score_adj biases the kernel's choice so that a different process is picked first, and adding swap gives the machine somewhere to page to before the killer runs at all. Neither one saves the process that does get chosen.
A userspace daemon can kill earlier and more politely than the kernel does. earlyoom watches memory from outside the kernel, and its own page says it "checks the amount of available memory and free swap up to 10 times a second". It picks the process with the highest oom_score, and "it will send the SIGTERM signal to the process that uses the most memory", holding SIGKILL back for a lower threshold. systemd-oomd is the same idea inside systemd, working from pressure metrics. A SIGTERM gives a process the chance to exit cleanly, which is not the chance to keep its work.
Ray does the killing itself rather than waiting for the kernel. A memory monitor in each raylet kills a worker when node memory passes 95 percent, and the killed task is retried, "infinitely (not respecting max_retries)" in Ray's own words unless max_retries is set to 0. Ray describes the monitor as work-preserving, which means it kills a Ray worker before the kernel kills a Ray system process, not that the task's progress survives. The same page says "the default memory monitoring system makes no guarantees."
On Kubernetes the standing answer is to diagnose and then resize. The vendor guides that come up for OOMKilled (Komodor, Dash0, groundcover, Netdata, Fairwinds, Spacelift) all arrive at the same two options, raise the limit or fix the leak. A Spark driver pod killed while its executors stay healthy gets the same answer on Stack Overflow: tune the driver's memory fraction and overhead settings. A thread on r/kubernetes with more than 60 comments describes how that goes in practice: "check some metrics, guess a new limit (or just double it), and then pray". The container restarts from zero either way. Pipeline tools such as Nextflow and Snakemake can resubmit a step that died for memory, and the step starts again at its beginning.
Slurm's own project once considered something else. SchedMD bug 694, filed in April 2014, records the plan: "We plan to develop a new slurm.conf parameter that will not kill jobs if they use more memory than requested." The cgroup plugin still enforces the request today.
Every one of these still ends the process. What they change is who picks the victim and how much notice it gets. Why raising the limit does not fix the pattern, and what breaks the guess-and-raise loop, is the subject of Why everyone over-requests memory on a shared cluster.
What changes if the job can be saved instead of killed?
The alternative to ending the victim is saving it. Checkpointing means writing down the state of a running job so it can be brought back later, and a job saved that way can give up its memory without giving up its work. The sequence runs in four steps.
- Detect memory pressure.
- Checkpoint the victim instead of killing it.
- Free the memory.
- Resume the victim at its last checkpoint, on a node with more memory.
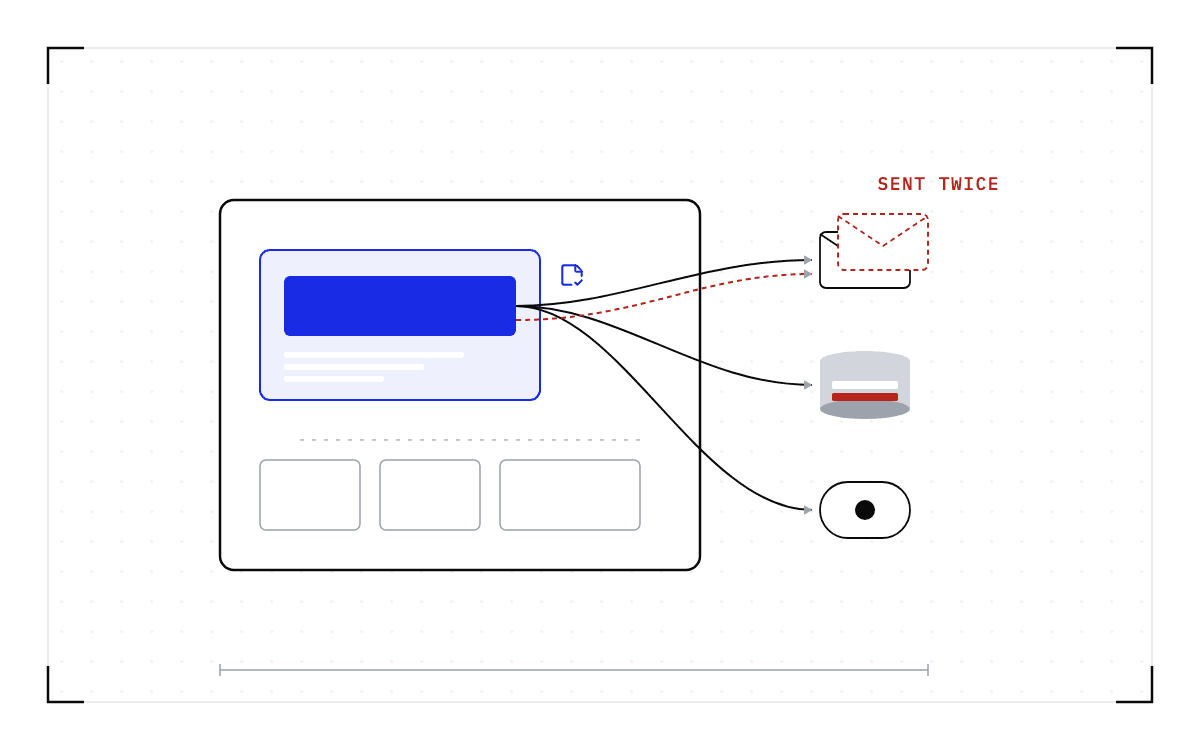
Nothing about victim selection changes. The kubelet can go on choosing exactly the pod it would have chosen, using the same priority and overage ranking, and Slurm can go on enforcing the limit the user asked for. Only what happens to the chosen process changes. With a checkpoint taken while the job ran, the work lost drops from everything since the last application save to the time since the last checkpoint, and the job is down for the length of the restore.
This is what we build at Cedana, and two policies ship today. You pick one. The first waits until the job fails and then resumes it at its last checkpoint after moving it to a compatible node with more memory. The second moves the workload to a node with the same GPU model and more free memory before it fails. Compatible means the same GPU model, driver, engine and model versions: the destination has more memory to give, it is not a different kind of GPU. Cedana does not yet resize a running allocation automatically. That is in build.
The scheduler administrator of a large university cluster wants a different response when a job exceeds its memory limit: the system should "reschedule you with basically twice the amount of memory", automatically. Granting that wish still loses the work while the kill is the only action, because the rescheduled job starts from zero. It becomes safe to grant once the correction saves the job instead of killing it. Cedana is automated GPU checkpointing and migration infrastructure that increases the useful work your GPUs deliver. We take the checkpoint while the job runs, below the application and with no change to it. The next time your job runs out of memory, the system still gets the memory back, and the job continues from its last checkpoint.
Related:
- Why everyone over-requests memory on a shared cluster
- Can Linux pause a process instead of killing it when memory runs out?
- What happens to a GPU pod when Kubernetes ends it
- What cannot be checkpointed in a GPU workload?
Common questions
Can I recover a job that crashes with an out-of-memory error, instead of losing everything and starting over?
If nothing saved the job's state before it was killed, the work it had done is gone, and no command run afterwards brings it back. Checkpointing means writing down the state of a running job so it can be brought back later, and a job saved that way can give up its memory without giving up its work.
Why was my container OOMKilled even though the node had memory to spare?
Three memory limits can end a job, and each has a different owner. The node's physical memory belongs to the kernel. The container's or job's memory limit is set by whoever wrote the pod spec or the Slurm allocation, and the kernel enforces it through cgroups. The GPU's own memory is the third, fixed by the hardware, and running out of it raises a framework error rather than an OOMKilled container.
How does the OOM killer decide which process to kill?
The kernel ranks the candidates. It gives each one a number often called the badness score, and the process holding the most memory is usually the one that goes. A long run with a large resident set is the natural victim.
Where do I find the record of what killed my job?
Where to read the record depends on what killed the job. On a bare machine the kernel log holds the event and dmesg prints it. On Kubernetes the kubelet's journal on the node holds the same event, and kubectl describe shows the pod's last state as OOMKilled with exit code 137.
After my container is OOMKilled, does it come back where it left off?
By default, no: on Kubernetes the pod status records OOMKilled, the container exits with code 137, and the restart policy brings it back from zero. With a checkpoint taken while it ran and restored on a node with more memory, the work lost drops to the time since the last checkpoint, plus the restore.