

TL;DR
- You write a memory number before the job runs, and if you guess low the job is killed for memory, sometimes after hours or days of work.
- Every guide answers that kill with the same advice, request more memory, and for the job you just lost the advice is right.
- It does not stop the kill coming back, because the Slurm memory limit you typed holds until the job finishes, so the next number is another guess.
- Guessing high costs you nothing and costs the cluster a lot. The scheduler counts an allocated GPU as busy whether or not the job holding it is using it.
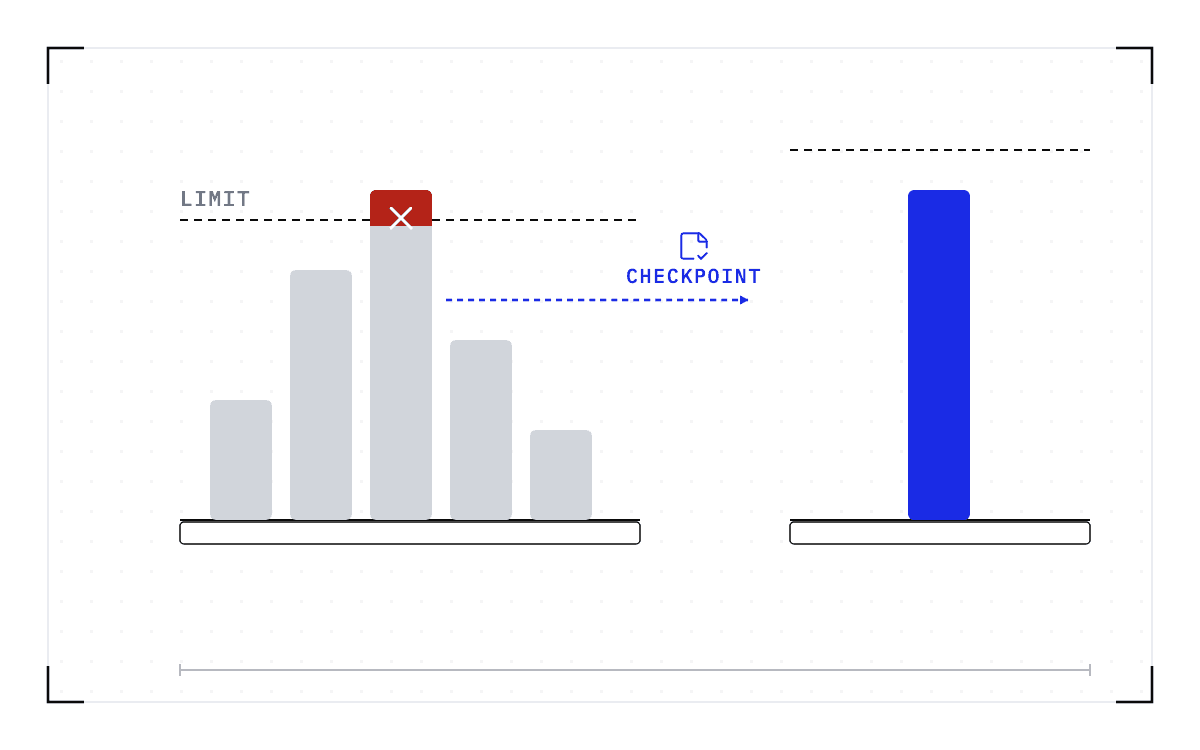
- What breaks the loop is being able to save a running job and restore it. A job that asked for too little memory then resumes at its last checkpoint on a node with more memory, as long as the GPU there is the same kind.
- In this piece we walk through why every answer says request more memory, what a wrong guess costs on each side, and what the over-request costs the cluster. We also cover whether a pipeline retry fixes it, and what changes when a kill becomes a save.
Why does every answer say request more memory?
Every center page that documents the oom-kill message gives the same answer, and for the job you just lost it is the right one: the number in your submission script was too low, so raise it. An oom-kill event on Slurm can mean exactly that, a job that used more RAM than its script requested, and the fix in Princeton's memory guide is --mem or --mem-per-cpu. To pick the next number you read what the last run used, which is what seff and MaxRSS report for a finished job.
Slurm reads --mem=0 as the whole machine, because its sbatch documentation defines the option as granting the job access to all memory on each node. The peak you read afterwards is sampled rather than continuous: Slurm's configuration documentation sets the default task-usage sampling interval at 30 seconds and allows it to be changed, so a short-lived memory spike can fall between samples.
Ten centers publish a page on the oom-kill message, among them Ohio, Michigan State, Yale, Harvard, NERSC, and Princeton, and every one of them tells you to request more memory or to move the job to a bigger or bigmem node and try again.
You arrive at those pages after a kill, so the pressure is to get the job running again. One user describes a job that "seems to need more memory than it specified in the submission script and then dies due to cluster regulations", and the answer for that job is the one the pages give: the number was too low, so ask for more.
What does a wrong guess cost?
Every job on a shared cluster starts as a request for a number of GPUs, an amount of memory, and a length of time, and you write those numbers before the job runs. Guessing low and guessing high are then handled by different layers, at very different prices.
| What you underestimated | What happens | Who set the limit | What you lose |
|---|---|---|---|
| Host memory | The machine runs out of memory, the kernel cannot reclaim enough to keep operating, and it invokes the out-of-memory killer, which selects a task to sacrifice | The Linux kernel | The run |
| Memory in the Slurm request | The memory figure typed at submit time becomes a cgroup limit, and Slurm's cgroup.conf documentation says a job or step that exceeds the hard limit can trigger out-of-memory events, including oom-kill | Slurm, through the kernel's cgroup limits | The run |
| GPU memory | An allocation that does not fit fails inside the process and the framework raises an error. PyTorch documents torch.cuda.OutOfMemoryError as the exception raised when the device is out of memory | The framework, inside the process | The run, unless the application catches the error |
None of those three kills is a defect in the layer that performs it. The kernel has no other way to protect the rest of the machine, and Slurm is enforcing the figure you typed. An application can catch the framework's error, but most do not. What happens after that kill, and how to read the record it leaves behind, is covered in What happens when a cluster job runs out of memory.
Nothing corrects the guess while the job is running, in either direction. A running job cannot grow into more memory, and the Slurm FAQ, asked whether a job can change size after it starts, offers a decrease and nothing else. It also says what the decrease costs: job steps running on the nodes the job gives up "will be killed unless initiated with the --no-kill option", and "A new accounting record is generated when a job is resized, showing the job to have been resubmitted and restarted at the new size."
So the numbers you write at submit time hold until the job finishes. Guessing low can cost days, because these jobs often run for hours or days before the kill arrives. Guessing high costs you nothing. You make the request once, at submission, and you make it high.
The same guess sits in a pod spec, where the number is a memory limit rather than --mem, and the loop after each kill is the same. A platform engineer on Reddit described that loop as "check some metrics, guess a new limit (or just double it), and then pray it doesn't happen again". An asker on Stack Overflow had already doubled the memory limit on the pod and expected the OOMKilled to return with the next traffic or file-size spike.
What does the over-request cost the cluster?
Faced with that arithmetic, everyone submitting work adds a margin. On customer clusters we see researchers request 6 to 8 GPUs and use 2 to 3, because the extra cards bring extra memory and under-asking risks an out-of-memory crash. That is a pattern we have watched rather than a measured statistic, and it turns up at organizations with little else in common.
A Fortune 100 pharma R&D team told us that over-allocation was its biggest utilization problem, bigger than maintenance windows or interruptions from higher-priority jobs. At a university supercomputing center, over-allocation of GPU and memory sat on the same problem list as wait times for GPU access, and the center said it was lengthening those waits. A growth-stage AI company running on Kubernetes could not oversubscribe its nodes, because memory use cannot be predicted from the large reservations its users make.
All three were describing over-provisioning, meaning capacity handed out and then not used. None of them described careless users, only a system where the request is the only protection anyone has against a kill nobody can see coming.
That margin costs the cluster because the scheduler counts an allocated GPU as busy whether or not the job holding it is using it, and no other job can have it without killing the one that holds it. So spare capacity sits inside allocations, and a job that needs GPUs waits while idle GPUs sit inside someone else's.
Capacity planning inherits the same error, because the people who decide whether to buy more hardware treat every requested GPU as in use, even when many of them sit idle and cannot be reclaimed without interrupting the job. How much of a fleet this accounts for varies by cluster, and an allocated, idle GPU is recorded as utilized, so nothing in the reporting shows it.
You can measure your own gap from records the site already keeps. Take the top jobs by GPU allocation over the last month, and put the GPUs each one requested next to the GPUs it used at peak. The gap between those two columns is the over-allocation the cluster is carrying, job by job.
Memory has the same two columns. Put the memory each job requested next to the MaxRSS in its accounting record, and the gap is what the cluster handed out and nobody used. Treat that gap as a ceiling rather than a floor, because memory spikes can fall between the samples reported by sacct, so a sampled peak can understate what the job touched.
Can the pipeline just retry with more memory?
The pipeline can retry, and each retry starts the failed step again from its own beginning. Snakemake users whose step is killed for memory are told to set --restart-times and to scale the memory with the attempt number, and Nextflow users retry on exit code 137, the exit status of an out-of-memory kill.
So the step gets a bigger number on each attempt until one attempt fits, and whatever it had computed before each kill is computed again. One Nextflow user could not even get that far, because the runner did not capture exit status 137 from an out-of-memory failure inside a piped command, so the retry logic never saw a failure to retry.
A retry with more memory repeats your guess automatically until the job has enough memory. The pipeline pays for it in the work each attempt throws away.
What changes when a kill is a save?
A request made once can still be corrected, as long as the running job's state can be saved and restored. That takes four steps.
- Checkpoint the running job in full, meaning its GPU memory and CUDA context, the process and its memory, its open files, and its network connections.
- Release the allocation, so the GPUs and memory the job was holding go back to the scheduler.
- Resubmit the job at the size it uses, and let the scheduler place it.
- Restore the checkpoint on the new allocation, and let the job carry on from where it stopped.
That sequence is what we build at Cedana, and two parts of it run today. A job that runs out of memory resumes at its last checkpoint on a node with more memory, and a job can be moved off a node before it fails. Automatic right-sizing of an oversized request is in build.
On Slurm we already run the sequence for a different reason, to carry a job past its wall-time limit, ending with a restore on a compatible node, meaning the same kind of GPU with room to spare. A resize would be the same sequence with a different allocation on the way back. Take a job that asked for 8 GPUs and uses 2: after the resize it would continue on 2, and the other 6 would go back to the queue for whatever is waiting. That is the part in build.
The same four steps correct an undersized request today, which is what matters while you are deciding how much memory to ask for. With Cedana checkpointing the job while it runs, a job that asked for too little memory resumes at its last checkpoint after being moved to a compatible node with more memory, instead of dying at the out-of-memory line. The bigmem node stops being where the run starts over and becomes where it continues, so guessing low stops costing the run and the request can shrink.
A resize costs a save and then a restore, so the job pauses while it happens. Restore time follows the size of the checkpoint, meaning how many bytes have to move, not the parameter count.
Something still has to decide when to resize, and that decision belongs to a policy, written once by the operator and applied across the cluster, with the threshold set at the policy level rather than on individual jobs. For a job that is about to run out of memory, the operator chooses the policy ahead of time: it either waits for the failure and resumes the job afterwards, or moves the workload to a node with the same GPU model and more free memory before it fails. Both run today, with no operator involved once the policy is set.
None of this creates memory. A step that needs more than the node has still needs a bigger node, and the request still has to be right in the end. What changes is what a wrong request costs on the way there. Cedana is automated GPU checkpointing and migration infrastructure that increases the useful work your GPUs deliver. On a shared cluster that means a job that runs out of memory comes back at its last checkpoint on a node with the memory it needs, so the work up to that checkpoint comes with it. Once right-sizing ships, the same save will bring a job back on an allocation that fits what it uses, and you will keep writing --mem while the correction happens underneath.
Related:
- What happens when a cluster job runs out of memory
- Can Linux pause a process instead of killing it when memory runs out?
- How much of your GPU utilization was work you kept?
- Sharing GPUs without fixed MIG slices
Common questions
After my container or pod is OOMKilled, does it resume, restart cleanly, or come back where it left off?
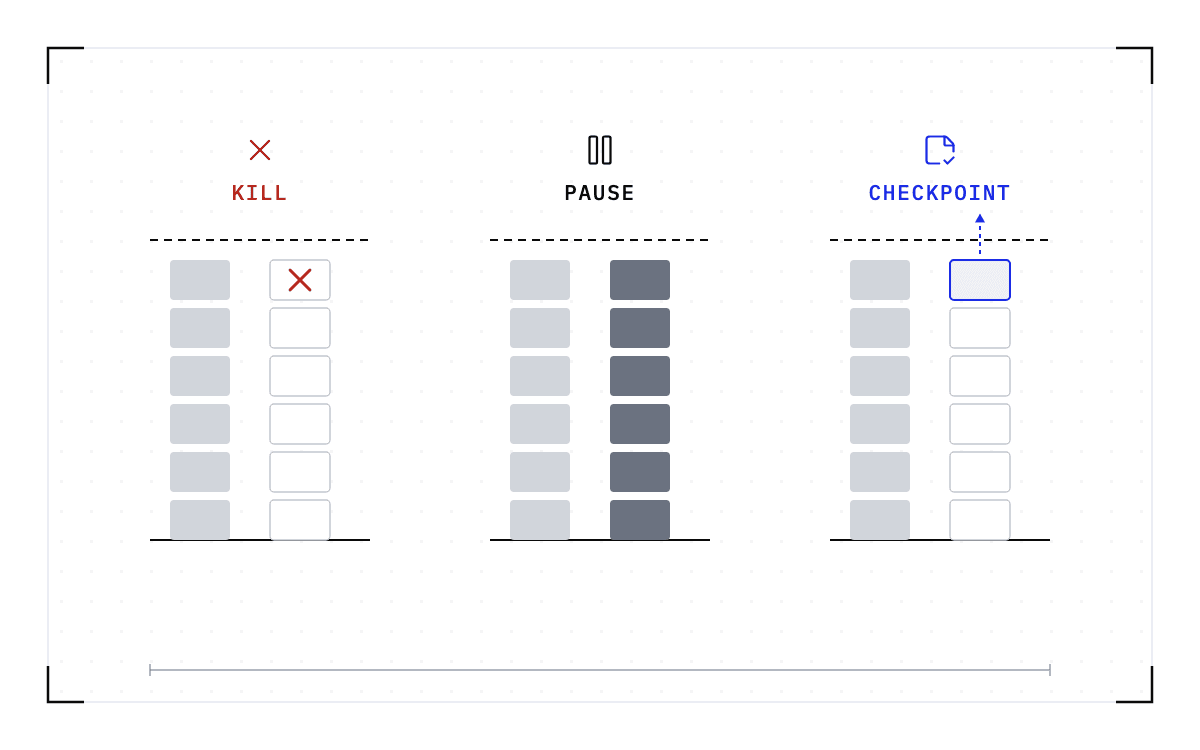
By default it restarts from zero: the pod status records OOMKilled and the restart policy brings the container back from its first line. With Cedana checkpointing the job while it runs, it resumes at its last checkpoint after being moved to a compatible node with more memory, and the bigmem node stops being where the run starts over and becomes where it continues.
Raising the memory limit does not stop the OOMKilled pattern from coming back. What's the actual fix, beyond just bumping the number?
Raising the limit is a new guess, and nothing corrects a guess while the job runs. The fix is to make the request correctable: checkpoint the running job in full, release the allocation, resubmit at the size the job uses, and restore the checkpoint on the new allocation. Cedana runs that sequence today to carry a job past its wall-time limit and to move a job that runs out of memory. Automatic right-sizing of an oversized request is in build. Guessing low stops costing the run, so the request can shrink.
My pipeline fails a step with an OOM kill, often exit code 137. Can it retry with more memory without recomputing what already finished?
No. A Snakemake or Nextflow retry restarts the failed step from its own beginning, so whatever the step had already computed before the kill is computed again. The retry does raise the memory on each attempt until one attempt fits, and the price is the work each attempt throws away.