

TL;DR
- Your GPU utilization reading counts the time a kernel was running on the card. It does not say whether that hour produced work you kept, repeated work lost to a failure, or loaded a model. You pay the same rate for all three.
- The fleet averages people quote, 5% in one vendor's own research and around 52% in a Microsoft trace, were measured in different ways. None of them separates a first run of an hour from a second run of the same hour.
- Track effective utilization instead, the share of GPU-hours that produced work you kept. Two corrections to the reading you already have, one for recompute after a failure and one for model loading, give you that number from records your cluster already keeps.
- A checkpoint, a saved copy of a running job's state complete enough to bring the job back later, changes which hours count. A failure then costs the work since the last checkpoint rather than the whole run, and a job that can be moved does not have to be killed to give a GPU back.
- In this piece we walk through the three numbers that get called GPU utilization, how the published averages were measured, and the four kinds of GPU time that produce nothing. Then we cover the two factors that turn your dashboard reading into your effective number, the three steps that give you both from your own accounting data, and which of those hours a checkpoint reaches.
Three numbers are all called GPU utilization
Most dashboards reuse nvidia-smi's own number, the nvidia-smi GPU utilization reading. NVIDIA's query guide defines GPU utilization as the share of the sample period during which a kernel was executing, which is a measure of activity over time rather than of capacity or GPU efficiency. The manual page puts that period between 1 second and 1/6 second depending on the product, and one kernel on one multiprocessor satisfies the test while the rest of the card does nothing.
So a reading of 0% in the middle of a training run means no kernel was executing when the sample was taken, which usually means the GPU is waiting for data, and that version of low utilization already has a settled answer. PyTorch's tuning guide recommends tuning num_workers and setting pin_memory=True for asynchronous loading and faster host-to-GPU transfers, because the default setting, num_workers=0, makes data loading synchronous and done in the main process, and a PyTorch forum explanation describes preloading images into RAM when they fit. This page is about the other case, the hours your dashboard counted as busy that produced nothing you kept.
DCGM is NVIDIA's Data Center GPU Manager, and it measures the same idea one level down, at the multiprocessor. Its user guide defines SM Activity as the fraction of time at least one warp was active on a multiprocessor, averaged over all multiprocessors, and it then qualifies the word active: a warp waiting on a memory request counts as active, so active does not mean computing. NVIDIA also states the threshold. "A value of 0.8 or greater is necessary, but not sufficient, for effective use of the GPU."
SM Occupancy is another field in the same tool, the fraction of resident warps on a multiprocessor relative to the maximum number of concurrent warps a multiprocessor supports, and NVIDIA warns that higher occupancy does not necessarily indicate better GPU usage.
MFU, model FLOPs utilization, is not a reading you take off a tool at all. The PaLM paper defines it as the ratio of the observed throughput in tokens per second to the theoretical maximum throughput of a system operating at peak FLOPs, so you work MFU out from the model and its observed tokens per second, and the activity metrics above do not report it for you.
All three describe a step that is running, and none separates a first run of an hour from a second run of the same hour.
The fleet averages people quote were measured in different ways
Cast AI's own page puts average GPU utilization across Kubernetes clusters at 5%, with about 95% of GPU capacity paid for and unused, and that figure is the vendor's own research rather than an independent trace.
Writing in March 2026, vexxhost puts many AI clusters at only 30 to 50% GPU utilization, and says that when GPT-4 was trained on 25,000 A100s, average utilization hovered at just 32 to 36%.
The MLOps Community contrasts what teams estimate with what they measure: most AI teams put their GPU utilization above 60%, while in reality most GPU clusters run at less than 20% utilization. A 2025 ACM paper by Sencan and colleagues reports jobs at a GPU utilization of 71.77%, with memory utilization significantly lower at 28.64%.
Jeon and co-authors, on Microsoft's Philly clusters for USENIX ATC 2019, called the allocation figure misleading and put the hardware utilization of GPUs in use at only around 52% on average. Weng and co-authors, tracing 6,742 GPUs in Alibaba PAI for USENIX NSDI 2022, reported a median instance usage of 0.042 GPUs against a median request of 0.5 GPUs, much smaller than the median request. Those two are published traces whose authors say what they measured, which is what separates them from the vendor figures above.
The people paying for the hours put their own numbers on it, and an infrastructure engineer on r/kubernetes, in a thread titled "So, 95% GPU rented sits idle?", describes capacity held in reserve for nobody: "We have A100s reserved through 2026 that barely hit 20% utilization. The finance team treats them like insurance, not infrastructure." A platform engineer on r/mlops did the arithmetic on an H100 cluster and reached a monthly figure: "We're burning roughly $45k/month on gpus that sit idle 40% of the time."
A commenter in that thread says ownership, chargebacks, and scheduling discipline matter as much as technical fixes, but none of those measures touches the four kinds of time this page counts.
Effective utilization is the share of GPU-hours that produced work you kept
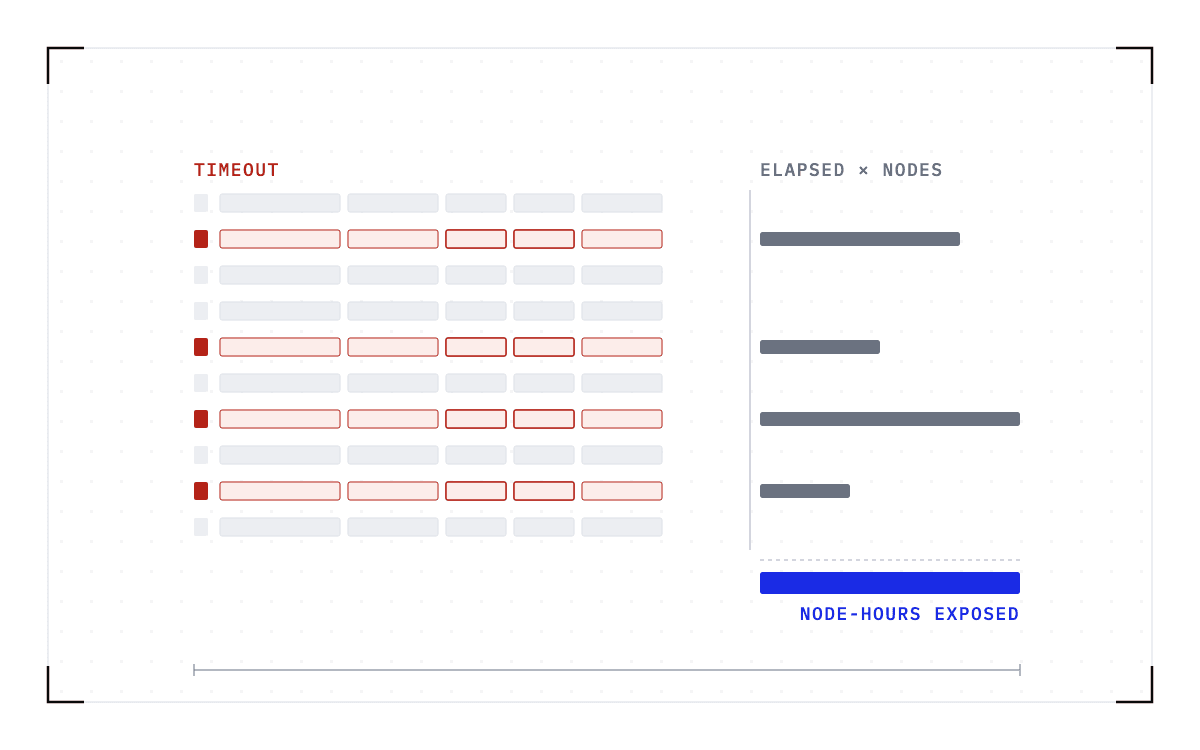
Your dashboard cannot report that share, because it samples each GPU and records only whether the GPU was busy or sitting inside an allocation. Nothing in the sample says what the GPU was doing, or whether anything came of it. So a dashboard can show 90% GPU utilization and no completed job at all, which is what happens when a 10-hour job fails at hour 5 or 6 on every attempt and restarts from the top each time.
Four kinds of GPU time produce nothing anyone keeps
A failure makes the GPU run the same hours twice. A job that dies at hour 5 of 10 is requeued from the start, so the GPU is busy for every hour of both attempts. Kokolis and colleagues studied 11 months on two of Meta's machine learning research clusters, and on one of them, 60% of scheduled jobs completed, while measured by runtime instead of by job, attributed hardware failures touched 19% of GPU runtime and affected less than 1% of jobs.
An allocation the job never uses is idle on the card and busy in the accounts. A researcher requests 6 GPUs and computes on 2, holding the other 4 as insurance against an out-of-memory crash, because under-asking risks the whole run and resizing a running job means restarting it. Capacity planners count all 6 as in use, and the idle 4 cannot be reclaimed without interrupting the job.
A known maintenance window empties the cluster before it starts. Administrators of a Fortune 100 pharma R&D cluster told us that people stop submitting jobs in the days before a known shutdown, because with a 3-day job to run and 2 days left, the researcher waits. So the cluster idles ahead of the window as well as during it.
A model has to be loaded before it serves anything, and the GPU is held for the whole load. Alibaba Cloud's deployment documentation says a full-version DeepSeek-R1 can take 20 to 30 minutes to load, and the GPU is busy throughout the load while serving nothing. The waste never trips an alarm.
Two factors turn your dashboard reading into your effective number
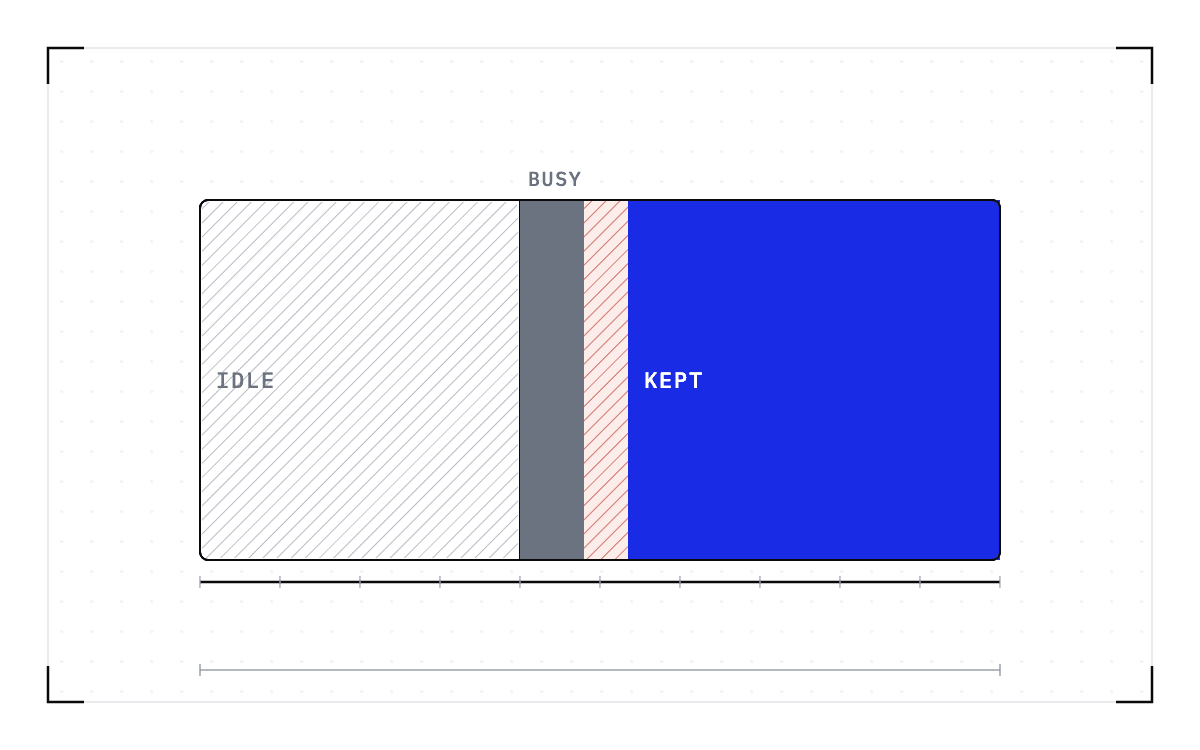
Both factors apply to the busy hours your dashboard already counted, and the denominator does not move: it stays the fleet's total GPU-hours in the window, the number of GPUs multiplied by the hours. The reliability factor is the share of busy hours that were not recomputing work lost after a failure. The cold-start factor is the share of what is left that was spent computing rather than initializing a model.
Effective utilization = dashboard reading x reliability factor x cold-start factor
The corrections multiply rather than add, because each removes a share of what the term before it counted. Suppose recompute took a quarter of the busy hours, putting your reliability factor at 0.75, and initialization took a quarter of what remained, putting the second factor at 0.75 as well. Then 60% x 0.75 x 0.75 is about 34%. Both 0.75 figures are assumptions, so 34% is a worked example and not a measurement of any cluster.
Three steps on your own accounting data give you both factors
You can get both factors out of systems your cluster already runs, in three layers. The allocation layer is the GPU-hours the scheduler handed to a job, which you read in Slurm accounting or in a pod's resource requests. The activity layer is DCGM's share of each sampling interval in which a GPU's engines were active. Useful output is the third layer, and you calculate it by subtracting initialization from the active GPU-hours on jobs that reached a normal end.
Fix the window and the sampling rate before you collect the data.
- Sum GPU-hours by final job state. In the accounting records, such as sacct on Slurm, total the GPU-hours of every job by the state it ended in. Count as lost the busy GPU-hours on a job that did not complete, from its last saved state to the failure, or all of its busy hours if nothing saved state. All busy GPU-hours minus the lost hours, divided by all busy GPU-hours, is your reliability factor.
- Compare requested GPUs with per-GPU activity over the life of each completed job. A job that asked for 6 GPUs and left 4 idle throughout held a reservation that computed nothing. Those GPU-hours were never busy, so report them as their own share of the fleet's GPU-hours rather than inside the cold-start factor.
- Take the time from allocation to first useful output as the cold-start share, across the jobs whose hours were not lost. For a model server that is the time to ready-to-serve from the server's own readiness signal, and for a simulation the time to the first step written. Subtract those hours from the busy GPU-hours that were not lost, and what is left, divided by those hours, is your cold-start factor.
Report the reliability factor by job count and by runtime, because the two disagree, as they do in Meta's paper. Read both as estimates, since the accounting cannot see work repeated inside a job that did complete. If you cannot name either factor from your own records, that is the finding.
Which of those hours does a checkpoint reach?
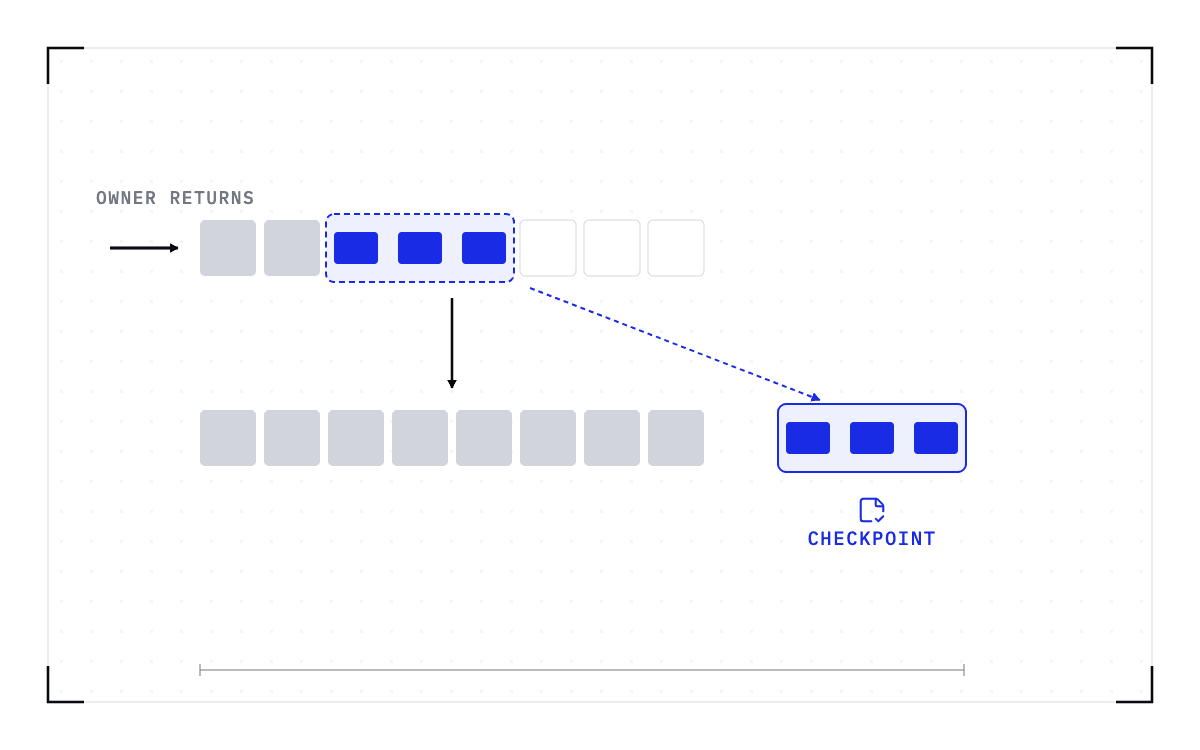
Recompute after a failure is the kind a checkpoint reaches most directly, because the repeat shrinks to the work done since the last checkpoint and the hours before it are kept. The hours a job holds without using them become reclaimable, and so do the days before a maintenance window, because a job that can be moved does not have to be killed to give a GPU back.
The cold-start hours turn into restore time rather than disappearing. On one node of 8x B200 GPUs, Cedana's published benchmark restored fully initialized engines in 57 to 70 seconds, against 9.4 to 34.2 minutes to start the same models natively, both measured to ready-to-serve. Those runs held their checkpoints in tmpfs, a file system in the node's own memory. Restore time follows the size of the checkpoint, meaning how many bytes have to move, not the parameter count.
What a checkpoint does not change
We add no metric and no dashboard. The three layers come out of DCGM, your scheduler's records, and your serving stack's own timers, whether or not we are running.
Checkpointing reduces recompute only if the job was checkpointed before the failure, so a job whose state was never saved restarts from the beginning. How often a checkpoint is taken is the operator's policy setting, and the work since the last one repeats on the resume.
Cedana does not decide where a job goes. An operator or an agent starts a move, which costs a restore plus the work since the last checkpoint.
The destination has to match the origin. A checkpoint records the GPU, driver, engine and model versions it was taken against. If any of them changes, the checkpoint is invalid and the workload cold-starts instead.
What ships today depends on how many nodes the job spans. The single-GPU and multi-GPU-on-a-single-node tiers ship in production today. Multi-node, where a single workload spans hundreds or thousands of GPUs across many nodes, is in design partnership with leading enterprises and neoclouds. If your jobs span nodes and this is the case you need solved, talk to Cedana about a design partnership.
Both factors are worth measuring, because the hours they subtract are hours a saved job does not have to run twice. Cedana is automated GPU checkpointing and migration infrastructure that increases the useful work your GPUs deliver. We save the state a running job holds and bring it back from its last checkpoint, so the hours before that checkpoint are kept. Start with your reliability factor: the hours it takes out of your number are the hours a resume keeps.
Related:
- How to fill idle GPUs without killing the job that fills them
- Why an idle notebook keeps its GPU until you kill it
- How long do agentic sessions run, and where does their state live?
- When the node dies under a Jupyter session
- Sharing GPUs without fixed MIG slices
- How to put a dollar figure on the GPU-hours that produced nothing
Common questions
What should I track instead of the GPU utilization percentage nvidia-smi or my dashboard reports?
Track effective utilization, the share of GPU-hours that produced work you kept, rather than the raw activity reading. Your dashboard records only whether a kernel was running on the card, so it does not separate a first run of an hour from a second run of the same hour lost to a failure, or from an hour spent loading a model, and an allocation that holds GPUs without using them never shows up as busy at all.
Why does my GPU utilization read low, oscillate, or sit at 0% during training, and what do I do about it?
A GPU that reads 0% in the middle of a training run is usually waiting for data. PyTorch's tuning guide recommends tuning num_workers and setting pin_memory=True for asynchronous loading and faster host-to-GPU transfers, since the default num_workers=0 setting makes data loading synchronous in the main process.
Is there a way to close the gap between what we pay for and what our GPUs deliver, instead of accepting reserved capacity that sits idle?
An infrastructure engineer on r/kubernetes reports reserved A100s that barely hit 20% utilization, and a platform engineer on r/mlops put the cost of that gap at roughly $45,000 a month on an H100 cluster. Checkpointing lets a job be moved off a GPU instead of killed for it, which is what makes an idle GPU reclaimable in the first place. See How to fill idle GPUs without killing the job that fills them for how that works.