

TL;DR
- When a user asks for a longer time limit, you need a number, and your Slurm accounting database already holds one. Every job the limit killed is recorded as a TIMEOUT.
- Counting those rows is not a count of lost work. Some applications save themselves just before the limit and never produce a TIMEOUT. A requeued job runs its batch script from the beginning, so the same work gets paid for twice.
- What
sacctsupports is a measure of exposure: the node-hours that reached the boundary, GPU-hours where the accounting tracks GPUs, ranked by the applications, users and policies they sit under. - That ranked list is what tells you whether the wall-time limit is worth engineering around on your cluster.
- In this piece we walk through the sacct query that returns a whole window, the two fields that turn its rows into node-hours, and what the data cannot tell you about the work itself. Then we cover how to rank by repetition and count the retries, and where the exception queue hides the jobs that never time out.
Every wall-time kill is already recorded as a TIMEOUT
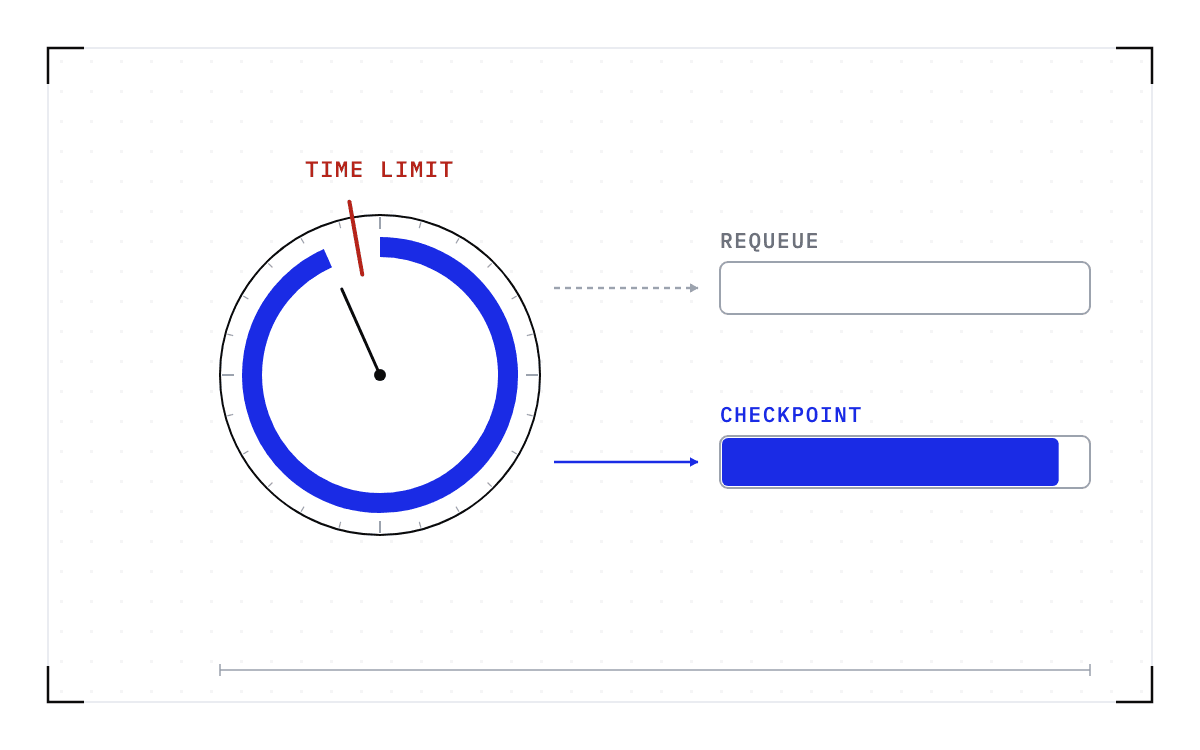
In Slurm, each job runs against a declared time limit. Partitions and quality of service (QOS) policies set the defaults and the maximums. When the enforced limit expires, Slurm terminates the job and records it as a TIMEOUT, so the kill is already in your accounting database before you go looking for it.
TIMEOUT is its own recorded state, separate from CANCELLED, FAILED, NODE_FAIL, OUT_OF_MEMORY, and PREEMPTED. So a job killed at the limit is never mixed in with a job someone stopped by hand or a job whose node died, and you can count the terminations without filtering anything out afterwards.
The record says nothing about how far along the work was. On a cluster with a 24-hour limit, Slurm terminates the workload whether it had just started or was 95% complete.
One sacct query returns the whole window
sacct prints the accounting records Slurm keeps for jobs and job steps, so one command over one window returns every job the limit killed, including who ran it, which policy it ran under, how long it ran, and how many nodes it used.
sacct --allusers --allocations \
      --starttime 2026-06-01 --endtime 2026-08-30 \
      --state TIMEOUT --parsable2 \
      --format=JobID,User,Account,JobName,Partition,QOS,Timelimit,Elapsed,ElapsedRaw,AllocNodes,AllocTRES,Submit,End
--allocations gives you one row per job rather than one row per step. --parsable2 writes the fields pipe-delimited with no trailing delimiter, so a spreadsheet or a script can read the output as it comes.
Every field in --format is either a key, something to rank by, or a term in the arithmetic below.
| Field | What it is for |
|---|---|
JobID | The key for each record |
User | Ranking by user |
Account | Ranking by group or project |
JobName | Ranking by application, approximately |
Partition | Which policy the job ran under |
QOS | Which limit applied, and where the exceptions sit |
Timelimit | The limit the job was killed against |
Elapsed | Reading the records by eye |
ElapsedRaw | The elapsed time in seconds, the first term in the arithmetic below |
AllocNodes | The nodes the job held, the second term |
AllocTRES | The GPU count, on clusters that track GPUs |
Submit | Resubmission patterns |
End | When the kill landed |
A state filter with no window returns nothing
The state filter needs an explicit window. Slurm will not show you a job that is not currently running unless you give a start time or an end time, and a job still going is not in TIMEOUT yet, so a query without --starttime and --endtime comes back empty.
Who runs the query changes what comes back. The root user sees the accounting data for all users, while anyone else sees only their own jobs by default, and the PrivateData option in slurmdbd.conf can narrow the view further. This is a measurement an administrator makes.
Pull the window once and do the arithmetic offline, because every call sends a remote procedure call to the accounting daemon and Slurm asks operators not to run sacct from loops in shell scripts or other programs.
Two fields turn those rows into node-hours
ElapsedRaw is the job's elapsed time in seconds and AllocNodes is the number of nodes it held, so multiply the two, divide by 3,600, and you have the node-hours in one terminated allocation. Sum that across every TIMEOUT record in the window and you have the total for the cluster.
GPU-hours follow the same arithmetic with the job's GPU count from AllocTRES in place of the node count. That works on clusters whose accounting tracks GPUs as a trackable resource. If your accounting does not track GPUs, the GPU column is not in the data and node-hours are what the window supports.
Call that total the exposed node-hours, because it counts the compute that reached the boundary rather than the work you know was lost. A TIMEOUT record says an allocation reached its declared limit and was terminated, and it says how many nodes were held and for how long. It does not say what the application had written to disk or whether anyone picked the work up from there.
The data cannot tell you whether the work was lost
Some applications stop themselves before the limit and save what they need. GROMACS takes a wall-clock budget with its -maxh option, and a simulation given one stops at the first neighbor search step after nearly all of that time has gone and writes a checkpoint file before it exits. A run configured that way ends just short of the limit with its state on disk, so Slurm never records a TIMEOUT for it at all.
Not every application has that option, and the accounting data cannot tell you which of your jobs used it, because Slurm records the state of the allocation and nothing about what ran inside it. It has no view of whether a checkpoint file exists or whether the user could restart from it. So the arithmetic measures how much compute reached the boundary, and what happened to the work at that boundary is a question for the application.
One study of another cluster found machine-learning jobs ending in TIMEOUT more often than generic jobs. In "How Do ML Jobs Fail in Datacenters?", researchers at Vrije Universiteit Amsterdam analyzed a year of scheduler traces from the SURF Lisa cluster in the Netherlands and found that 4.38% of machine-learning jobs ended in TIMEOUT against 2.12% of generic jobs. That is one cluster in one year, so use your own accounting window to measure your cluster.
Rank by repetition, and count the retries
Group the records by JobName, User, Account, Partition, and QOS, then rank each group by the exposed node-hours attached to it. An application that reaches TIMEOUT every week deserves a closer look than one that did it once in a quarter, whatever the node-hours on the single event. Those repeat offenders are the candidates for transparent checkpointing, meaning a checkpoint taken below the application rather than written into it.
The JobName field is a label the user supplies, so ranking applications by it is approximate, and two groups running the same program under different job names land in different rows.
Counting the retries takes a second pass over the same window, with two more fields added to --format. Restarts holds how many times a job has been requeued or restarted, and a requeue resets the submit time, so recovering the original submit time means asking for the duplicate records with --duplicates. SLUID, Slurm's unique identifier for each run of a job, changes on every requeue, restart, and resize, which is what distinguishes one run of a job from the next.
Those retries matter because a requeued job does not continue where it stopped. Slurm's sbatch documentation puts it in one sentence: "When a job is requeued, the batch script is initiated from its beginning." So a job that came back after a TIMEOUT began at zero unless the application found and loaded a checkpoint of its own.
Counting resubmissions under one job name is therefore counting repeated attempts at the same work, and the node-hours on the second attempt are exposed the same way the first ones were.
The exception queue holds the jobs that never time out
A job that finishes inside a longer limit never becomes a TIMEOUT record, so the exception queue is where the rest of the wall-time trouble sits. The University of Utah's Center for High Performance Computing publishes its cluster policies, and one line reads "Special access is given to a long qos to exceed the MAX walltime limit on a case-by-case basis". The standard maximum is 72 hours for jobs on general nodes, and that is one center's published policy rather than a description of how every site works.
An exception is paid for by the rest of the queue. Backfill starts a lower-priority job early in a gap, and the scheduler plans that gap around the expected end time of every running job, which is why Slurm's scheduling configuration guide says reasonably accurate time limits matter for backfill scheduling to work well. For each granted job, the scheduler plans around a much later declared end time.
Screening the exception queue uses the same window and the same fields. Run the query without the state filter, group by QOS, and count the jobs and the node-hours accumulating under the long QOS. Those jobs are the long-running population the TIMEOUT rows also point at, so they belong on the same screening list.
The accounting data shows how much compute runs under the exception. It does not show why any one job was granted it.
Use the ranked list to decide whether to act
The measurement comes before the policy change. Ninety days of your own history gives you a count of terminations, the node-hours attached to them, and the names that keep coming back, so you can decide whether the wall-time limit is worth engineering around on this cluster.
If your list says it is, then what has to change is what happens at the boundary rather than the limit itself. Cedana is automated GPU checkpointing and migration infrastructure that increases the useful work your GPUs deliver. On Slurm, that means Cedana checkpoints the running process as a job approaches its time limit, requeues the job, and restores it on a compatible node, so the application needs no checkpoint path of its own. The limit stays exactly where you set it, and the applications at the top of your ranked list are where you would start.
Related:
- Your Slurm job was cancelled due to time limit. What to do now
- Slurm has no suspend option for GPU jobs. What preemption without killing the job looks like
- DMTCP, application checkpoints, workflow managers and system-level checkpointing: what each covers on a Slurm cluster
- A 90-day wall-time PoC: what to measure before you change policy
- How much of your GPU utilization was work you kept?
Common questions
My job will be killed when it hits its time limit and I will lose all the progress since my last save. How do I make it save its state so it can pick up where it left off?
Some applications stop themselves before the limit and save what they need: GROMACS takes a wall-clock budget with its -maxh option and writes a checkpoint file before it exits, so Slurm never records a TIMEOUT for it at all. Where the application has no such option, Cedana checkpoints the running process as the job approaches its time limit, requeues the job, and restores it on a compatible node, so the next allocation continues the run instead of starting it again.
When Slurm requeues my job after a timeout, does it resume where it left off or restart the whole script?
A requeued job does not continue where it stopped: when a job is requeued, the batch script is initiated from its beginning, so a job that came back after a TIMEOUT began at zero unless the application found and loaded a checkpoint of its own. Counting resubmissions under one job name is counting repeated attempts at the same work, and the node-hours on the second attempt are exposed the same way the first ones were.
Why did my job get killed, and what does the TIMEOUT state mean?
In Slurm, each job runs against a declared time limit set by partition and QOS policies, and when the enforced limit expires, Slurm terminates the job and records it as a TIMEOUT. TIMEOUT is its own recorded state, separate from CANCELLED, FAILED, NODE_FAIL, OUT_OF_MEMORY, and PREEMPTED, and the record says nothing about how far along the work was.