

TL;DR
- GPU checkpointing saves the state of a running workload so the same work can be brought back later, on that node or another one. Cedana is automated GPU checkpointing and migration infrastructure that increases the useful work your GPUs deliver. You can install Cedana on a couple of test nodes and watch a workload checkpoint and restore the same afternoon.
- The install is the easy part. What makes the evaluation worth anything is written down before it: the workload it runs on, a baseline of what that workload does today, the numbers that would count as success, and the way back out.
- Measure the same workload twice, managed and unmanaged, side by side, with the same clocks on both. Recovery time, work lost per interruption, utilization at the job level, and steady-state overhead are the four numbers. The four most common ways to get them wrong are listed below.
- In this piece we walk through what goes on paper first, how to keep the install contained, and how to take the four measures so they compare. Then we cover how to define the two cold-start clocks, the six mistakes that produce misleading numbers, and how long each number takes to arrive.
Four things go on paper before anything is installed
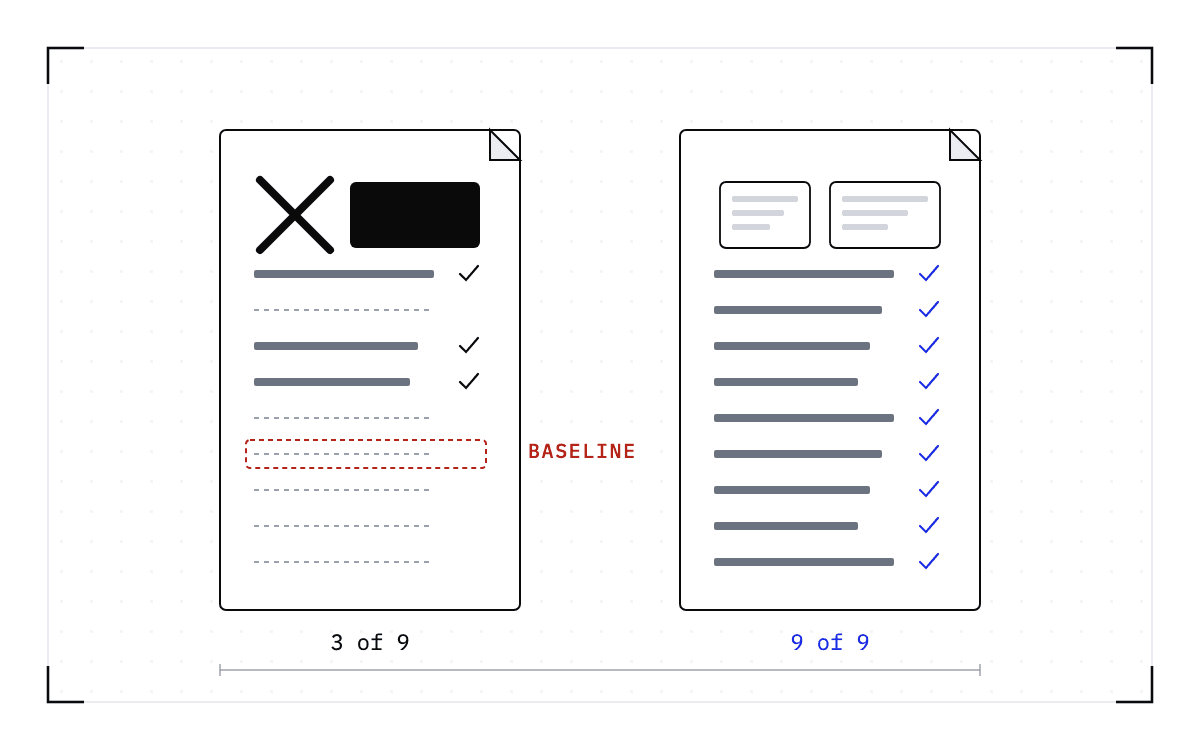
A proof of concept, or PoC, is a bounded evaluation on your own hardware that ends in a decision. Before the install, write down four things: the workload the evaluation runs on, a same-node baseline of what that workload does today, the numbers that would count as success, and how the software comes back out.
The success numbers matter most. Without them you have no agreed standard for judging the result, and the decision gets made in a meeting instead.
If you run a research computing center, you can start the baseline before installing anything, from the scheduler's own accounting history. Look at which jobs ended in a failure or a time limit, how many node-hours and GPU-hours were attached to them, and how often similar jobs were resubmitted. You can also hand that analysis to us: give us 90 days of anonymized Slurm accounting data, and we will estimate the node-hours and GPU-hours exposed to wall-time termination and identify which workloads are the best candidates.
When you present that history, say what it leaves out. Not every job that hit its time limit lost all of its work, so the numbers show where the loss is concentrated rather than the total.
Containing the install is the easy part
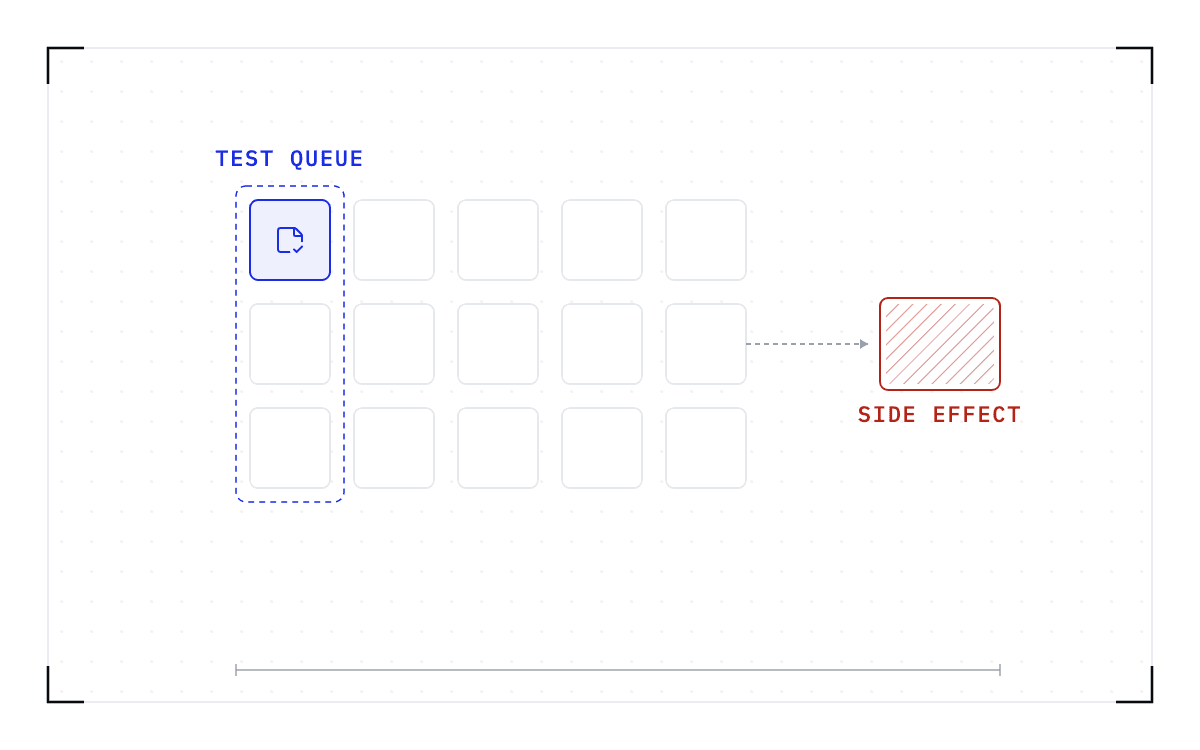
Cedana's guidance for a first deployment is one or two test nodes, one queue, and one non-critical workload. We deploy onto an isolated set of nodes and workloads. You choose the nodes, and inside those nodes you choose the queue or the individual workloads that take part.
Nothing is checkpointed until you opt a workload in. Until then the software is dormant, existing jobs and queues are not modified, no code is modified, and the researcher's workflow does not change.
On Slurm, the published installation documentation puts the minimum at a controller and one compute node, and every other compute node carries on as normal, without checkpoint and restore. The install is a plugin put in place by a script, with no Slurm restart. On Kubernetes, the install is a Helm chart with node affinities, so the daemon set lands only on the nodes you label.
The way back out is documented in the same places. On Kubernetes it is one command, a Helm uninstall of the release in the cedana-system namespace. The Slurm integration has its own removal command, listed in What changes on my cluster when I install Cedana?. Agree the exit with whoever installs it, and test it during the evaluation rather than assuming it, before you widen the deployment.
Those test nodes carry no production traffic, which is what makes it safe to break something on purpose. Injecting a real failure is the only way to get a recovery number.
Measure the same workload twice, managed and unmanaged
Take the four measures on the chosen workload before anything is installed, on the same nodes it will run on afterwards. Then keep an unmanaged copy of that workload running beside the managed one for the whole window, so the difference between the two is measured rather than inferred. A busy week on the cluster moves both numbers together.
| Measure | How it is defined | When it is taken | What makes it comparable |
|---|---|---|---|
| Recovery time | The time from the failure to the workload serving again on healthy hardware | By injecting the same failure into the unmanaged workload first, then into the managed copy | The same failure, injected the same way, on the same nodes, with both clocks starting and stopping on the same two events |
| Work lost per interruption | The compute between the last point the workload could be recovered from and the interruption, counted in GPU-hours | On the baseline from the scheduler's accounting history, where the recoverable point is the job's start or the application's own last checkpoint; on the managed copy, the interval since the last Cedana checkpoint | The same definition of an interruption on both sides, and a stated recoverable point for each |
| Utilization at the job level | The share of allocated GPU-hours that ended in delivered work, counting the hours a failed or time-limited job kept from its own checkpoints as delivered, rather than in lost work or an idle reservation | Across the whole evaluation, on both copies of the workload | A window long enough to hold the cluster's own mix of failures and maintenance, read the same way on both sides |
| Steady-state overhead | What the software costs the workload while it runs normally, with no checkpoint or restore in progress | On the baseline run, then on the managed run of the same workload | The same workload, the same nodes, the same run length, one variable changed |
Utilization is the measure an evaluation most easily gets wrong. Every cluster has a utilization dashboard, and the number on it is not the work the cluster delivers, because it counts a GPU that is busy recomputing lost work the same way it counts a GPU that is finishing something.
Recovery time in a live cluster is longer than a restore, because it includes the detection and scheduling that happen before the restore begins, and a published restore clock covers only the restore itself. Say which parts of recovery your number includes, and hold that definition on both sides of the comparison. This is also the number an auditor asks for. A recovery time objective, or RTO, is the time within which a service must be back after a failure, and the one you can promise is the one you have measured on your own hardware. Record the method beside the number: what was killed, what the clock started and stopped on, how many times you ran it, and what state the workload was in when it came back.
Overhead is the one measure where we can give you our own number up front. Cedana's steady-state overhead is under 2%, often closer to zero. The interception work runs on the CPU, and a GPU workload usually leaves the CPU waiting on the GPU, so on a job that issues few driver calls per unit of GPU work the cost fits inside that waiting time. A microbenchmark that issues calls as fast as the GPU can take them shows the cost in full. Take the measurement on your own workload over a realistic length.
Define both cold-start clocks before the first run
Cold start is the measurement most likely to be argued about afterwards, because both sides of it are easy to define generously. Native cold start is the time from engine launch to ready to serve, including weight loading and full engine initialization. A Cedana restore brings the same fully initialized engine back from a checkpoint to ready to serve. Both clocks end at that same state, which is what makes the two numbers comparable.
Then record enough for somebody else to repeat the run.
- Serve the model with the official recipe for that model, unmodified. This is the step most often skipped, and it decides whether the native side of the comparison is honest.
- Record the hardware, the system memory, the driver and CUDA version, and the checkpoint size for every run.
- Report every run rather than the fastest one.
Restore time follows the size of the checkpoint, meaning how many bytes have to move, not the parameter count. So a larger model does not automatically produce a longer restore, and without the checkpoint size written beside each restore time, the numbers cannot be compared across models.
Cedana's own published cold-start benchmark records the same things. Every run was on a single node with 8x NVIDIA B200 GPUs and 1.7 TB of system memory on CUDA 12.9. The models were served with SGLang using the official cookbook recipes unmodified, and the checkpoint size is reported for every row. The models in that set restored in 57 to 70 seconds. That is our result on our hardware, on models we picked. Your evaluation exists to produce the number on yours.
Six mistakes produce misleading measurements
- No baseline was taken, so there is nothing to compare the result with, and the argument depends on whose recollection of last quarter is sharper.
- A different clock ran on each side of the comparison, so the two numbers cover different spans of the same event.
- The workload was synthetic and nobody in the building runs it, so the result describes a program written for the evaluation.
- No real interruption was ever triggered, so the recovery path was never exercised and the recovery number is an estimate.
- Each configuration was run once, so a slow disk or a noisy neighbor on the node is indistinguishable from an effect.
- Two things were changed at the same time, so whatever happened afterwards cannot be attributed to either of them.
Some of the value will not fit inside the window. Say which numbers you measured and which you extrapolated from them, because an explicit extrapolation can be checked and an unstated one may only be discovered in month four.
Do not build the evaluation around one workload that behaves well. That tells you how the software handles that workload and nothing more. Throw the range of applications your cluster runs at the software and try to break it, because a failure found on two test nodes costs less than the same failure found after a rollout.
A working GPU checkpointing install is not a result
Plan an afternoon for the install and the first checkpoint and restore. Our guidance puts it inside an hour, on isolated nodes. A recovery-time number follows as soon as you inject a failure, which can be the same day. A utilization or throughput number takes weeks to months, because it waits on the cluster's own mix of jobs, failures, and maintenance to play out. We scope these evaluations at 3 to 4 months, and the duration flexes with what the success criteria need.
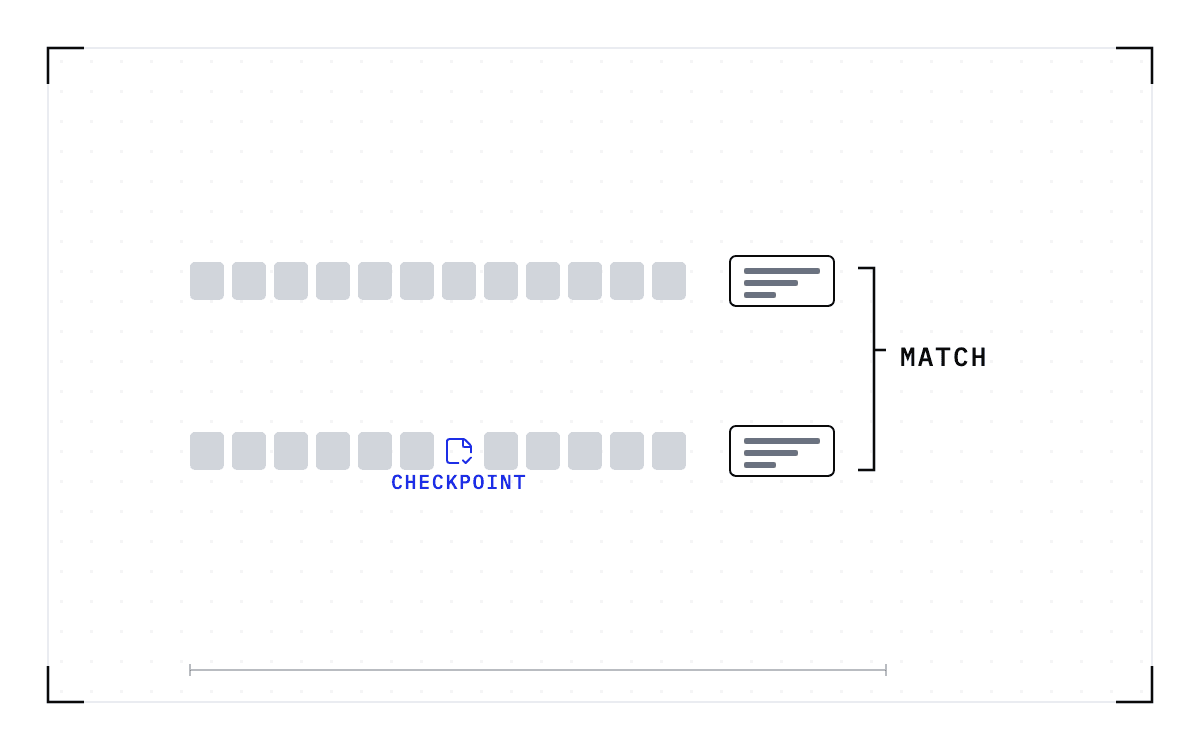
Whatever the window, what comes back after an interruption is the state as of the last checkpoint, so the work at risk is the time since that checkpoint was taken. That is the work-lost row in your own plan, and it is the number the whole evaluation turns on.
Common questions
How do I run a proof of concept for GPU checkpointing?
You can install Cedana on a couple of test nodes and watch a workload checkpoint and restore the same afternoon. The criteria for judging the evaluation must be written down beforehand, and the baseline recorded first, because the comparison rests on an unmanaged copy of the workload running beside the managed one.
What does a checkpointing layer cost while the workload runs?
Overhead is the one measure where we can give you our own number up front. Cedana's steady-state overhead is under 2%, often closer to zero.