

TL;DR
- Your fleet already raises the signals. DCGM counts ECC errors, records thermal violations and surfaces Xid events, and Prometheus keeps the trend. So the GPU metrics to monitor are in place before you write any policy.
- Most of those alerts get filed rather than acted on, because every response available to you, apart from cordoning the node, ends the job running on it.
- Pairing each signal with a policy that checkpoints the workload and restores it on healthy hardware makes the response cost a move instead of the running job.
- That action ships today. Of the five triggers below, the preemption notice already fires a checkpoint on Kubernetes and Slurm, and a maintenance window runs as a move an operator or an agent starts. The failure trend, the thermal throttle and the fragmentation threshold are still the design.
- In this piece we walk through why the alert goes unacted on, which GPU metrics to monitor you already collect, and the five signal and policy pairings. Then we cover which of them run today, and how to set the threshold that decides when one fires.
Nobody acts on the alert because every response ends the job
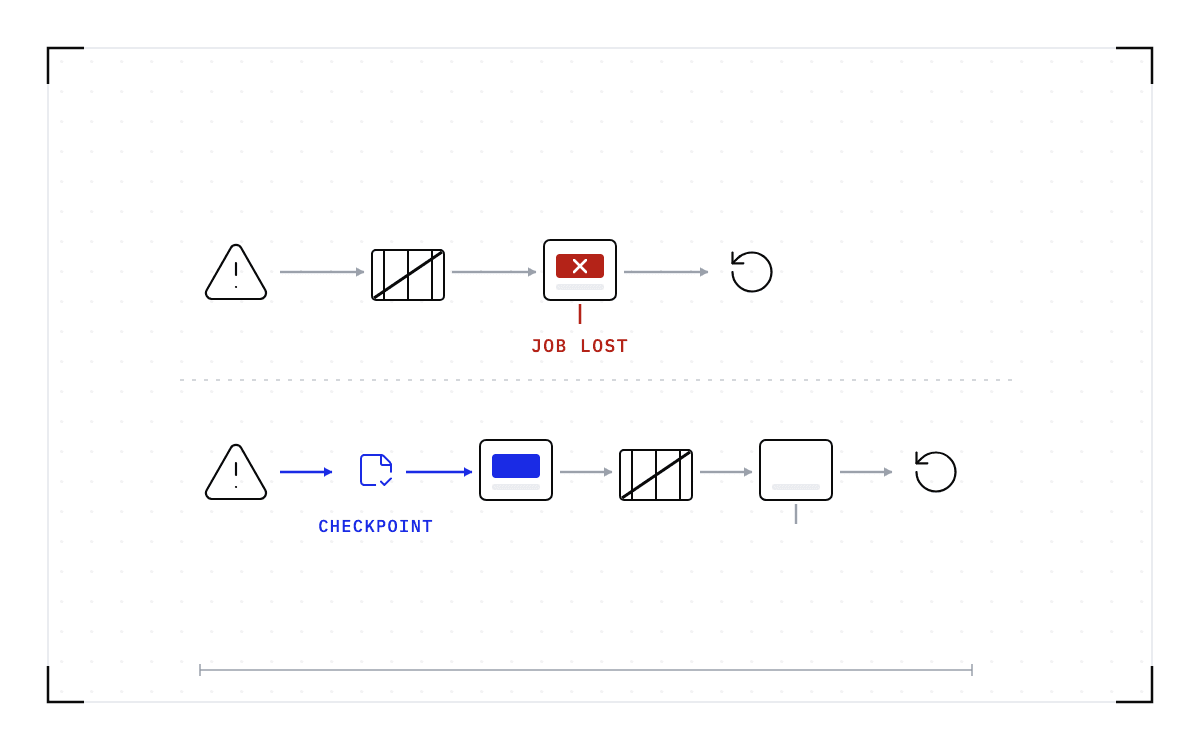
A fleet health pipeline finishes by taking the node out of service, so acting on the alert costs you the job. A drain, a GPU reset, and a reprovision all end the work running there. A quarantine cordons the node first, and a cordon only stops new work landing on it, so whatever is already running still has to be dealt with. Owning cluster health means making that trade on every alert, and most days the cheaper answer is to file it.
NVIDIA ships its own fleet health system with that last step switched off. NVSentinel runs across AWS, GCP, Azure, and OCI on clusters of up to 1,100 nodes and around 40,000 GPUs. Its documentation says, "By default, only health monitoring is enabled." Fault quarantine, the node drainer, and fault remediation are turned on afterwards through Helm values as an operator builds confidence in what the system does.
NVIDIA's own deployments run with full remediation enabled by default, according to the same page. So monitoring alone is the default a new installation starts with, not a limit of the tool. Observing and reporting is the reasonable setting for as long as the alternative ends the job.
The GPU metrics to monitor are already there
The metrics you need are the ones DCGM already reports, in its own vocabulary. It counts ECC errors against a lifetime limit, records excursions above a specified GPU thermal threshold, and surfaces Xid events, which cover driver-level faults such as a pending page retirement or a GPU falling off the bus. Its health checks restate those readings as findings, one of which is a thermal violation on a GPU in the last minute. Prometheus stores the series, so you read a trend rather than a single reading.
Acting on that telemetry without a person in the loop is not a new idea either, because DCGM can already be configured to do it at the hardware level: "A common action based policy is to configure DCGM to automatically retire a memory page after an ECC DBE has occurred." A condition fires and DCGM takes the configured action without anyone deciding. The same condition-and-action sequence works higher up the stack, and the obstacle there is that the available actions end the running job.
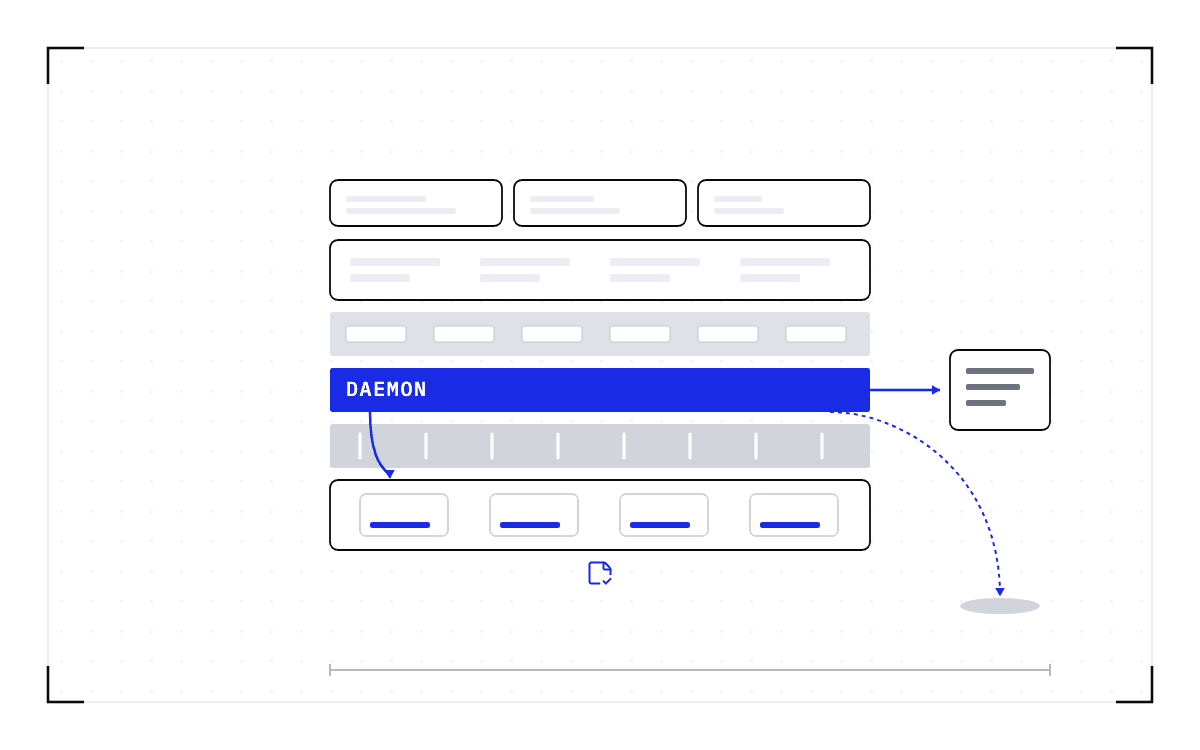
Three of the five signals below never appear in GPU telemetry at all. A preemption or reclaim notice arrives from the scheduler or from the cloud provider taking the capacity back. A fragmentation threshold is read off the scheduler's own view of what is allocated. The maintenance window is on the operator's calendar weeks ahead. So the inputs a policy needs are spread across the tools you already run. Cedana's control plane consumes DCGM, Prometheus, and NVSentinel events, so no parallel monitoring stack is needed.
One policy per signal, and the action is the same in all five
Checkpointing a workload means saving its full state so it can be brought back later. In every pairing below the action is the same: checkpoint the running workload, restore it on healthy hardware, and leave the node free to be taken out of service afterwards. So the five rows differ in the condition that fires, and your job is treated the same way in all of them.
| The signal | What fires it | The policy |
|---|---|---|
| Failure trend | A rising ECC error count or a driver-level fault on one GPU | Checkpoint the workload and restore it on a healthy node before the node is drained |
| Thermal throttle | A thermal violation on a GPU in the last minute | Checkpoint the workload and restore it on a node running inside its thermal limits |
| Preemption or reclaim notice | A scheduler or provider notice that the capacity is being taken back | Checkpoint before the notice expires and restore on the next allocation |
| Fragmentation threshold | Unallocated GPUs scattered too thin to place the next task | Checkpoint running jobs and restore them onto fewer nodes to free contiguous capacity |
| Maintenance window | A node scheduled for a firmware, driver, or engine update | Checkpoint each workload on the node, restore it on another compatible node, then drain a node that is already idle |
The action is live today, and most of the five triggers are still the design
The action in every row ships today, while most of the triggers that would fire it do not. Our checkpoint and restore mechanism is live, along with heartbeat checkpointing and automatic failover, so a workload resumes automatically through a failure. We can determine when to swap a workload in and out of a GPU, and an agent, meaning software that acts without a person in the loop, can trigger that swap. We can also detect a workload that is about to run out of memory, and an operator sets a policy that either waits for the workload to fail or moves it pre-emptively onto a compatible GPU with enough memory.
Of the five conditions in the table above, the preemption or reclaim notice already triggers a checkpoint today on Kubernetes and Slurm, and a maintenance window can be run as a move an operator or an agent starts. The failure trend, the thermal throttle, and the fragmentation threshold are still the design, and we do not fire on them today.
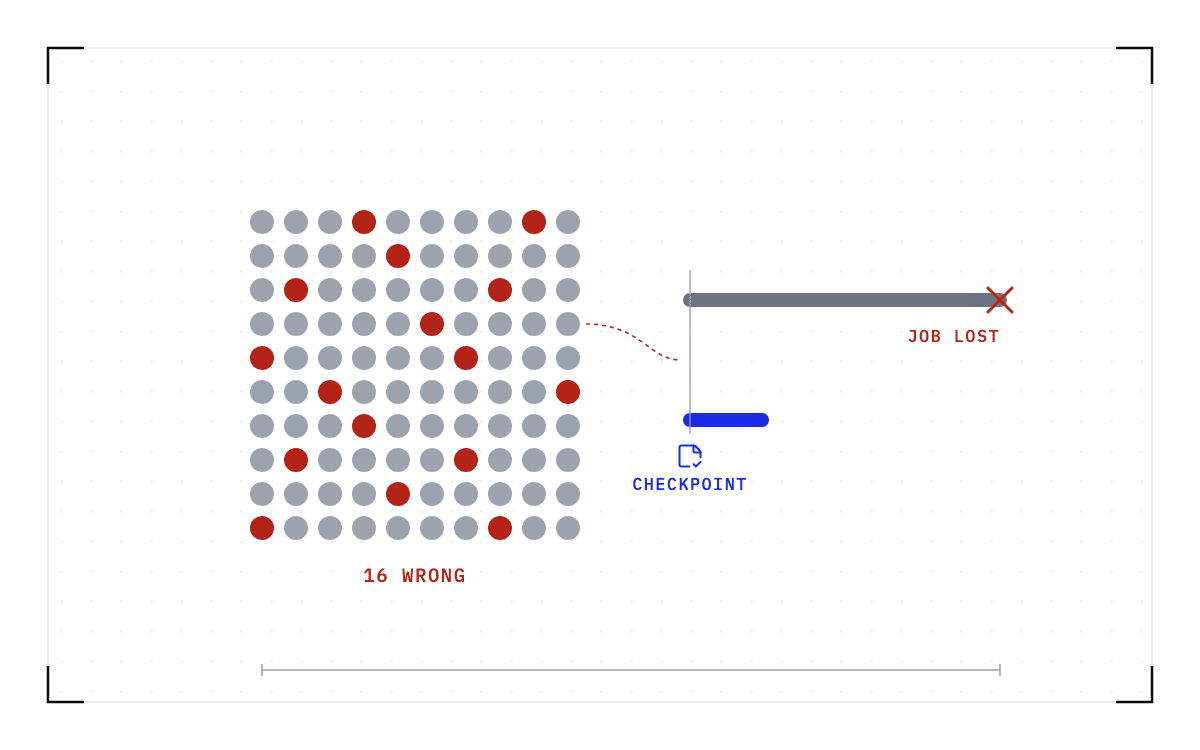
The failure row rests on prediction being good enough to act on, and Meta has published a result on that. Its lemon detection mechanism identified faulty nodes on its two research clusters at more than 85% accuracy. Taking those nodes out of scheduling moved the failure rate on large jobs, meaning jobs of 512 GPUs and more, from 14% to 4%. What Meta did with a suspect node was exclude it rather than move the work already running on it.
The failure-trend policy would act before a fault because a failure on one GPU affects the rest of the workload. NVIDIA describes the GB200 NVL72 as "a 72-GPU NVIDIA NVLink domain that acts as a single, massive GPU". In the illustrative failure-domain model used here, a workload running across all 72 GPUs stops as a unit when one GPU faults. That is a model of the workload's dependency, not a measured statement that 71 GPUs wait for the same failed GPU to return. So firing on the trend costs you a move, and waiting instead costs the recovery time of the whole domain.
In the thermal case nothing has failed, which is what makes it a judgment call. A job on a throttled GPU keeps running and delivers less for the same hour, so moving it pays when the throughput given up over the rest of the run is larger than what the move costs.
On the preemption row, the deadline is set outside the fleet. The notice period is whatever the scheduler or the provider gives you, and the checkpoint has to finish inside it.
The fragmentation row is about GPUs that are free and unusable at the same time. Weng and co-authors studied GPU fragmentation on a production cluster of more than 6,200 GPUs in a paper at USENIX ATC 2023. They describe one cluster that was fully packed and could not take new tasks while 500 of its GPUs sat unallocated. Packing the running jobs tighter is the obvious fix, but it requires moving them, and moving them is the one thing a scheduler cannot do once a job has started.
The maintenance row would fire on a cadence you already know, because inference engine and driver updates land every week or two. A cluster that holds long jobs back for days ahead of each window gives up more hours than the window itself takes.
The threshold is the operator's own arithmetic, written down once
A policy fires when the expected benefit of moving the work is larger than the cost of moving it, and that cost is the checkpoint written on the way out plus the restore on the way back. You already make that comparison on every alert, case by case. A threshold is the same comparison recorded once.
You can know what the move will cost in advance. Restore time follows the size of the checkpoint, meaning how many bytes have to move, not the parameter count. The write out moves those same bytes to storage, so both halves scale together.
The benefit side is whatever the fleet would otherwise lose. Row by row, that is the rest of the job on a failing node, the throughput given up to a throttle, the days a maintenance window holds work back, or the capacity a fragmented cluster cannot place.
In our design, the threshold belongs to the control plane, which does policy-based automation. You write the rule once, and it is managed at the policy level, not per job.
A policy that fires on a false reading costs the move and whatever the workload did since its last checkpoint, so setting each threshold means deciding whether that price is worth paying on that signal.
Detection on your fleet is already good, and what is missing is an action that saves the running work. Cedana is automated GPU checkpointing and migration infrastructure that increases the useful work your GPUs deliver. For the five policies above, that is the step they share: the workload is checkpointed and restored on healthy hardware, and the node still goes out of service afterwards. The signals in the table are already yours, so what changes is the price of acting on one of them.
Related:
- What to do when DCGM flags a GPU that has a job running on it
- Is it worth acting on a GPU failure prediction?
- What happens to a training job when a GPU fails
- How Cedana works: checkpoint, restore, and migration below the serving engine
Common questions
Once a GPU alert fires, what happens to the job already running on the node?
It ends, unless something saves it first. A fleet health pipeline finishes by taking the node out of service, and a drain, a GPU reset, and a reprovision all end the work running there, while a quarantine's cordon only stops new work from landing and whatever is already running still has to be dealt with. The policy that keeps the job alive instead is to checkpoint the workload and restore it on healthy hardware before the node is drained.
GPU failure prediction exists. What is the policy for the job running on a GPU that is predicted to fail?
In Cedana's design, the policy checkpoints the workload and restores it on a healthy node before the node is drained, and today an operator or an agent triggers that move on the signal. It would fire ahead of the fault because in this illustrative failure-domain model, a fault on one GPU stops a workload that depends on the whole NVLink domain, so firing on the trend costs a move while waiting costs the recovery time of the whole domain.
The tools I already use give me no single, unified way to know whether a GPU or node is healthy. Do I need to build my own?
No, because the sensing is already there. DCGM reports GPU health in its own vocabulary: it counts ECC errors against a lifetime limit, records thermal excursions, and surfaces Xid events, and Prometheus stores the series so you read a trend rather than a single reading. The gap is in what you can do about the reading, because the actions available on that signal all end the running job.