

TL;DR
- When a job dies at the wall-time limit, the request that reaches you is to raise the limit or grant that job an exception. Neither one tells you what the boundary is costing.
- Raising the limit is not a free move. Backfill, node turnover, maintenance windows and the backstop against runaway jobs all depend on jobs declaring when they will end.
- A 90-day proof of concept (PoC) answers the question from your own data. A screening pass over the cluster's Slurm accounting history sets the baseline. Then a 90-day window runs Cedana's checkpoint-and-restore path on a small set of workloads while the policy holds still.
- In this piece we walk through what the wall-time limit is protecting, what your accounting data can and cannot tell you, and how to review the candidate applications. Then we cover the three before-and-after measures, what changes at the boundary, and the thresholds to agree on before the window opens.
The wall-time limit is doing four separate jobs at once
Four separate parts of a shared cluster depend on every job declaring when it will end, so raising the limit loosens all four at once.
- Slurm's backfill scheduler starts a lower-priority job in a gap only when doing so will not delay a higher-priority reservation, and it calculates that gap from the declared end times of the running jobs, which is why SchedMD's own scheduling guide asks for reasonably accurate time limits.
- An allocation returns its nodes to the pool only when it ends, so even a fairly ordered queue leaves everyone waiting if running allocations never end.
- A node cannot be taken out of service until the last job on it has ended, so the longest limit on a partition defines the administrator's worst-case maintenance window.
- A hung process or an infinite loop would hold an allocation indefinitely, and ending that is what the limit is there for.
Wall-time limits are part of how a shared cluster remains schedulable. If you answer lost work by raising them, you give up some of the value of all four of those functions in order to keep one workload running. That is why the change deserves evidence, and why the PoC leaves the policy alone while it collects that evidence.
Slurm's own accounting data gives you half the answer
The first half of the PoC is a screening pass over 90 days of the cluster's own accounting history, and Slurm has already recorded what it needs. The sacct interface exposes job state, elapsed time, time limit, allocated resources, and TIMEOUT termination for every job the accounting database holds. Point it at an anonymized window of history, and those existing records give you the baseline half of every before-and-after measure. Ninety days is the window we ask for when a center wants us to run this screening pass ourselves.
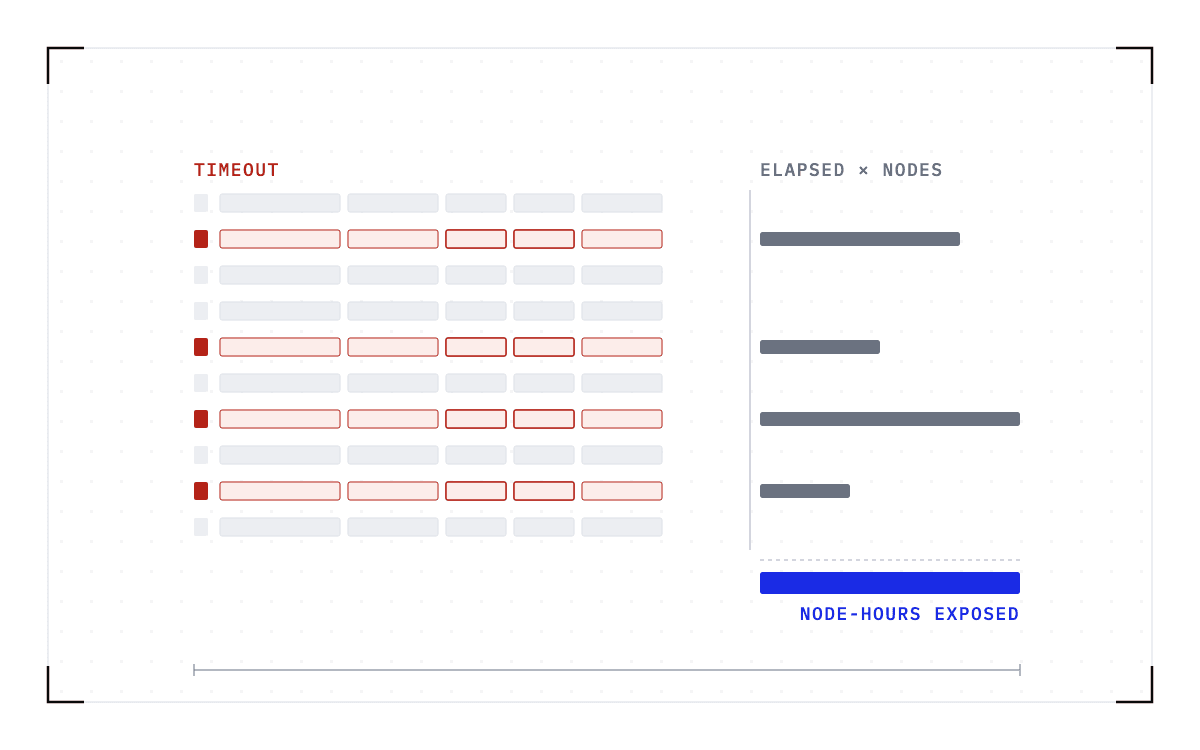
The pass looks for where the timeouts land, how much compute they hold, and which workloads could be checkpointed instead.
- How many allocations end in TIMEOUT.
- Which applications, users, and partitions repeat those timeouts.
- How many node-hours and GPU-hours are attached to them.
- How often similar jobs are resubmitted afterwards.
- Where long-running QOS exceptions are accumulating.
- Which workloads are the best candidates for transparent checkpointing.
A QOS, or quality of service, is the Slurm policy object that carries limits such as maximum wall time, and an administrator grants a long-running exception by giving a job access to a QOS with a higher limit. Those grants are therefore recorded somewhere you can count them.
What the accounting history cannot tell you is whether any of that work was lost. Some of those applications may have written native checkpoints before they were terminated, and the scheduler has no view of how recent or usable those checkpoints were. So the logs reveal where the boundary is being crossed, how much compute reaches it, and where a deeper application-level analysis should begin. The rest of the answer has to come from the applications themselves.
Only reviewing each application tells you whether the work survived
Take the applications that hit the limit most often from the screening results and inspect each one on its own. Keep that set small, because every application in it gets its own review, and everything the PoC measures afterwards is built on what those reviews find.
GROMACS is the case where the work already survives. The molecular dynamics engine writes a checkpoint at the first neighbor-search step after 99% of the specified time has elapsed, stops itself short of the limit, and continues from that file in its next allocation. The mechanism works, and GROMACS built every part of it.
Every other application on the cluster has to do for itself what GROMACS did, because the scheduler underneath supplies none of it. The application has to know which state matters, serialize it correctly, write it safely, expose a reliable restart path, and give the user a walltime-aware switch they have to know to set. One of the most mature applications in high-performance computing (HPC) needs a dedicated command-line option to survive a scheduler policy.
The authors of CRAFT, a library built to make application-level checkpoint and restart (CR) easier, put the trade-off in one line: "Application-level CR is the most effective CR technique in terms of overhead efficiency but it takes a lot of implementation effort."
The first question to ask of each candidate is whether it checkpoints at all. If it does, check how recent the last checkpoint was when the job was killed, and whether the restart path works when somebody runs it. Those two checks tell you whether the checkpoint was usable at the boundary, which is what the accounting data could not tell you.
Three before-and-after measures inform the decision
Track three measures on the candidate set and on the partitions those workloads run in: completion time, queue impact, and operator exceptions.
| Measure | Data source | What the before window establishes | What the after window shows |
|---|---|---|---|
| Completion time | sacct records for the candidate workloads | Submission to completion for each workload, including the resubmissions that follow a timeout | Submission to completion for the same workloads once reaching the limit triggers a checkpoint and a requeue |
| Queue impact | Wait times and backfill behavior on the affected partitions | How the queue behaves while the candidates are being killed at the limit | Whether that behavior holds steady once the candidates are checkpointed and requeued instead |
| Operator exceptions | The center's own record of long-QOS requests and grants | How many requests arrive, from which groups, and how many are granted | Whether the request rate falls once the candidate workloads survive the boundary |
Completion time reads correctly only once you know that a requeue brings back the batch script rather than the running job. Slurm's sbatch documentation puts it in one sentence: "When a job is requeued, the batch script is initiated from its beginning." Unless the application finds and loads a valid checkpoint, requeue means restart, not continue, so the baseline cost of a timeout is the whole run again.
Queue impact rests on backfill, which is why the PoC leaves the declared limits alone. Jobs make the same requests, so the scheduler does the same calculation in the after window as in the before window. What you are watching is whether wait times and backfill behavior on the affected partitions hold steady once the candidates are checkpointed and requeued instead of killed.
Exceptions exist because some work does not fit inside the standard time limit. The University of Utah's Center for High Performance Computing publishes one in the form of a long QOS granted case by case, by hand, and that is one center's rule rather than a standard. Every such exception weakens some of the predictability the wall-time policy was meant to provide, so counting the requests and the grants across the window tells you whether the pressure on that route is easing.
Hold the policy still and change only what happens at the boundary
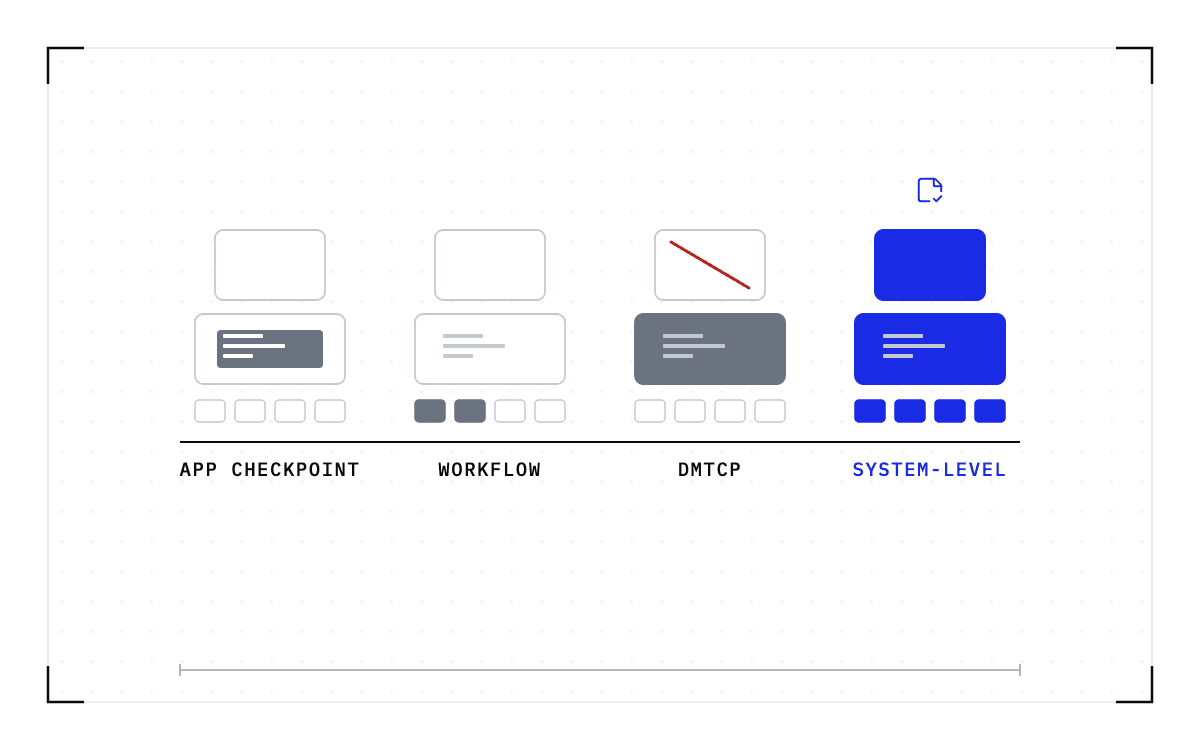
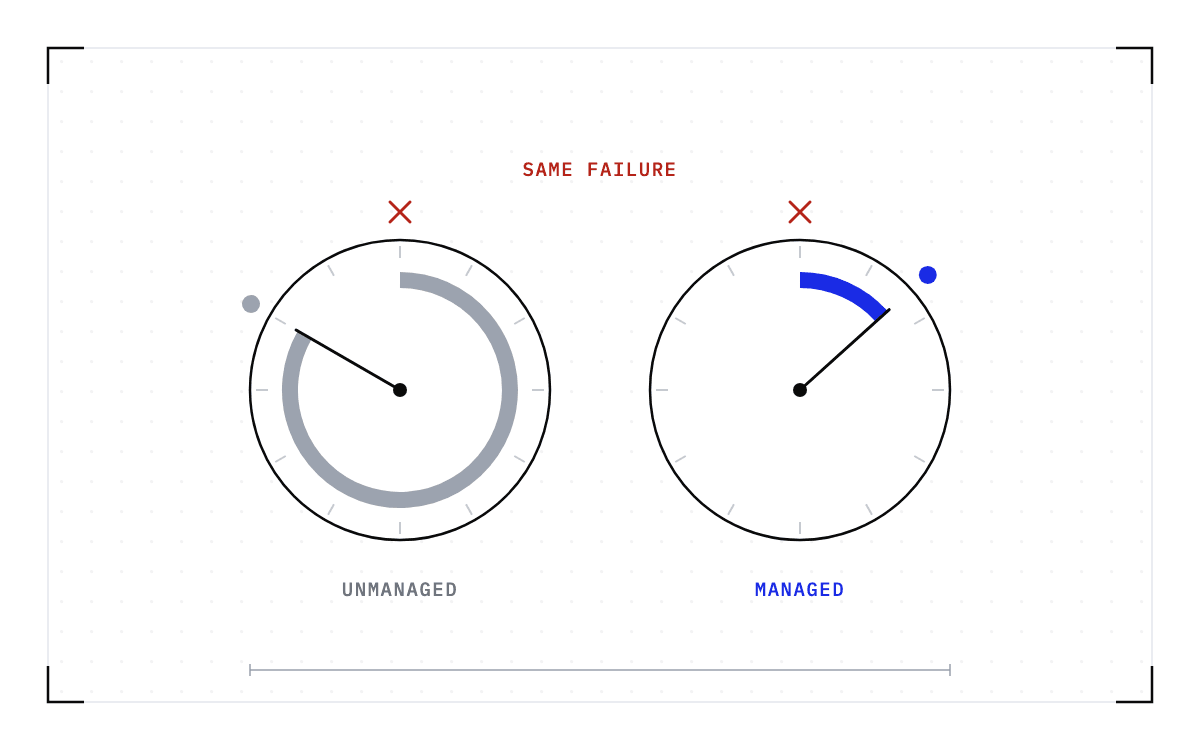
The second half of the PoC is a 90-day window in which one thing changes: on the candidate set, reaching the limit triggers a checkpoint and a requeue instead of a kill. Cedana's checkpoint-and-restore path saves the workload below the application as it approaches its time limit. The allocation is released, the job is requeued, and the workload is restored on a compatible node, with no application code changes and no application-specific checkpoint path. For those workloads, requeue means continue, not restart.
So on a cluster with a 24-hour limit, a week-long simulation still completes, and the limit never moved. We have demonstrated the same system-level checkpoint and restore with scientific workloads including GROMACS and Boltz-2.
Nothing else changes: the limit stays where your administrators set it, the partitions keep their configuration, and the QOS policies stay untouched, because a before-and-after comparison is only worth reading if the policy is constant across it.
Checkpointing costs something of its own, and the PoC records that cost rather than assuming it away. Young (1974) and Daly (2006) give formulas for the optimal checkpoint interval, and both balance the time required to save state against the recovery cost and the amount of computation at risk. How often to checkpoint is a policy setting, so it is one of the things the PoC chooses. Record the checkpoint time and the frequency used for each candidate next to its completion time, so both numbers sit in the same table.
Agree on the thresholds before the window opens
When the window closes you have four measured results: the node-hours and GPU-hours exposed to wall-time termination, the completion-time change on the candidate set, the queue behavior on the affected partitions, and the count of exception requests and grants. Every one of them came out of the center's own records, and no figure was carried in from outside.
You set the thresholds those numbers are judged against, and you have to set them before the window opens, because once people have seen a result they can read the same number in different ways.
Agreeing in advance on what a good result looks like is what turns 90 days of data into a decision, whichever way the decision goes. Cedana is automated GPU checkpointing and migration infrastructure that increases the useful work your GPUs deliver. On a research cluster, that means a job survives its own wall-time limit without the limit moving. Ninety days of your own accounting history is what tells you whether that is worth the operational change.
Related:
- Your Slurm job was cancelled due to time limit. What to do now
- Slurm has no suspend option for GPU jobs. What preemption without killing the job looks like
- DMTCP, application checkpoints, workflow managers and system-level checkpointing: what each covers on a Slurm cluster
- Measuring the cost of wall-time termination from your sacct data
- GROMACS shows both the value and the limit of application checkpointing
Common questions
My job will be killed when it hits its time limit and I will lose all the progress since my last save. How do I make it save its state so it can pick up where it left off?
Something has to save the running job's state before the kill and put it back afterwards. For the workloads in the PoC, that is what happens at the boundary: Cedana checkpoints the workload below the application as it approaches its time limit, the allocation is released, the job is requeued, and the workload is restored on a compatible node, with no application code changes. For those workloads, requeue means continue, not restart.
When a job is requeued after a timeout, does it resume where it left off or restart the whole script?
It restarts the whole script. When a job is requeued, the batch script is initiated from its beginning, so unless the application finds and loads a valid checkpoint, requeue means restart, not continue, and the baseline cost of a timeout is the whole run again.
Why did my job get killed, and what is the wall-time limit protecting?
Your job was killed because it reached the wall-time limit on its allocation, and that limit is doing four jobs at once: backfill needs reasonably accurate declared end times to fit a lower-priority job into a gap, turnover depends on allocations handing their nodes back, a node cannot be drained for maintenance until the last job on it ends, and the limit is what stops a hung process or an infinite loop from holding an allocation indefinitely.
How do I get access to a queue that allows a longer maximum wall-time?
Your center may publish an exception route. The University of Utah's Center for High Performance Computing publishes a long QOS granted case by case, by hand. That is one center's rule and not a standard. Every such exception weakens some of the predictability the wall-time policy was meant to provide, which is why counting the requests and grants across a window tells a center whether the pressure on that route is easing.